Visualisation of South African Electricity Data
Last Updated: November 2025 | Click images to enlarge
1. South Africa's Power System from a Geospatial Perspective
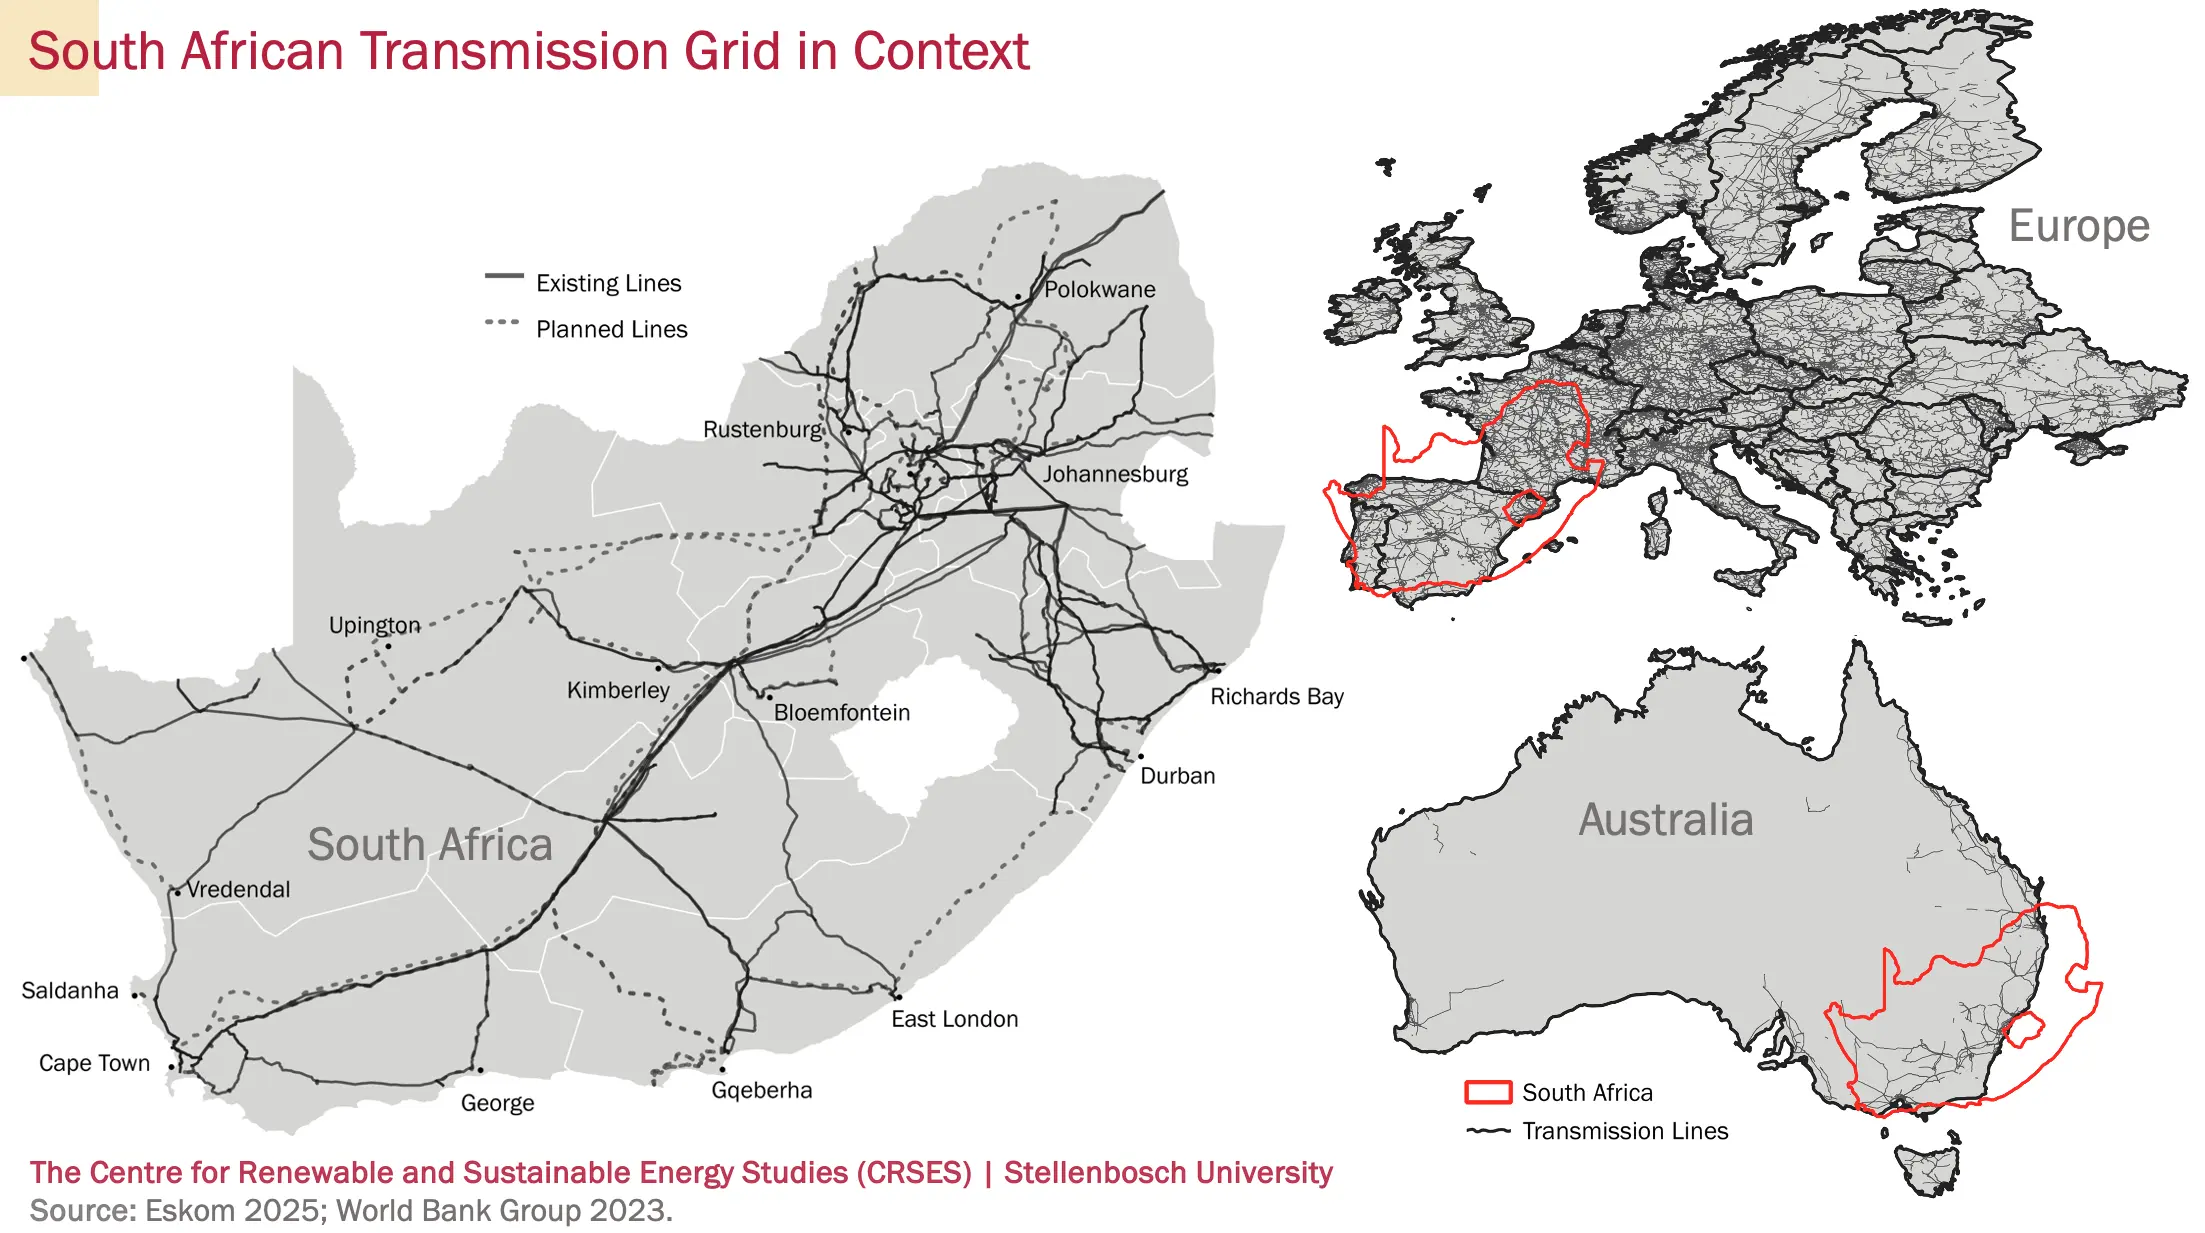
South Africa's power system is comparable in scale to that of Western Europe. It shares some characteristics with Australia's power system, such as extensive transmission lines with limited meshing and relatively weak interconnections with neighbouring countries.
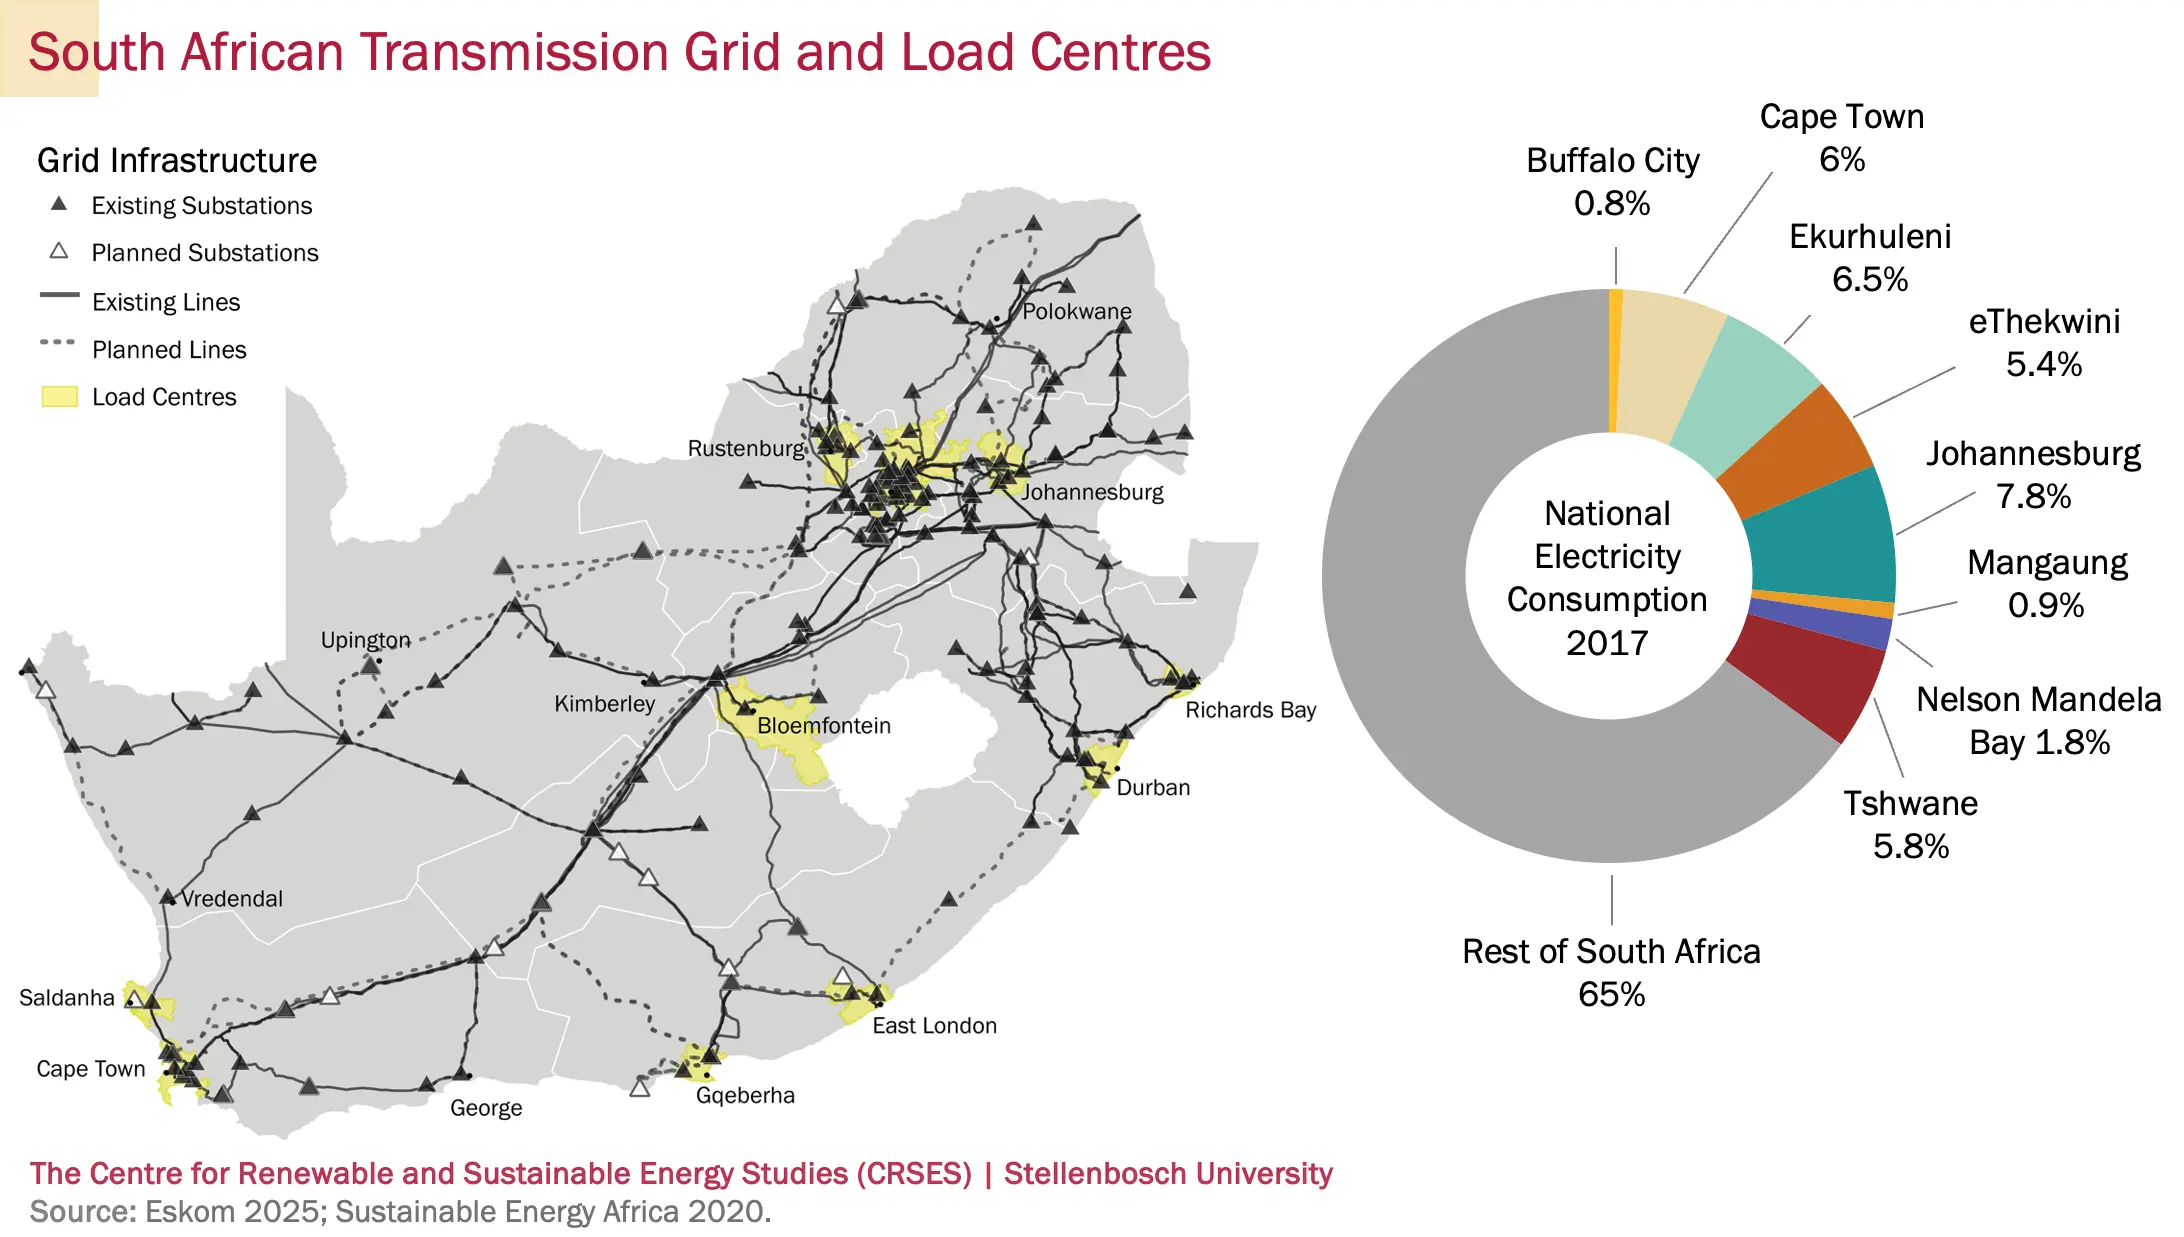
In 2017 (the most recent year for which data is available) around 35% of SA's electricity consumption was geospatially centred in the metropolitan areas shown in yellow below, with the largest consumption occurring in Johannesburg.
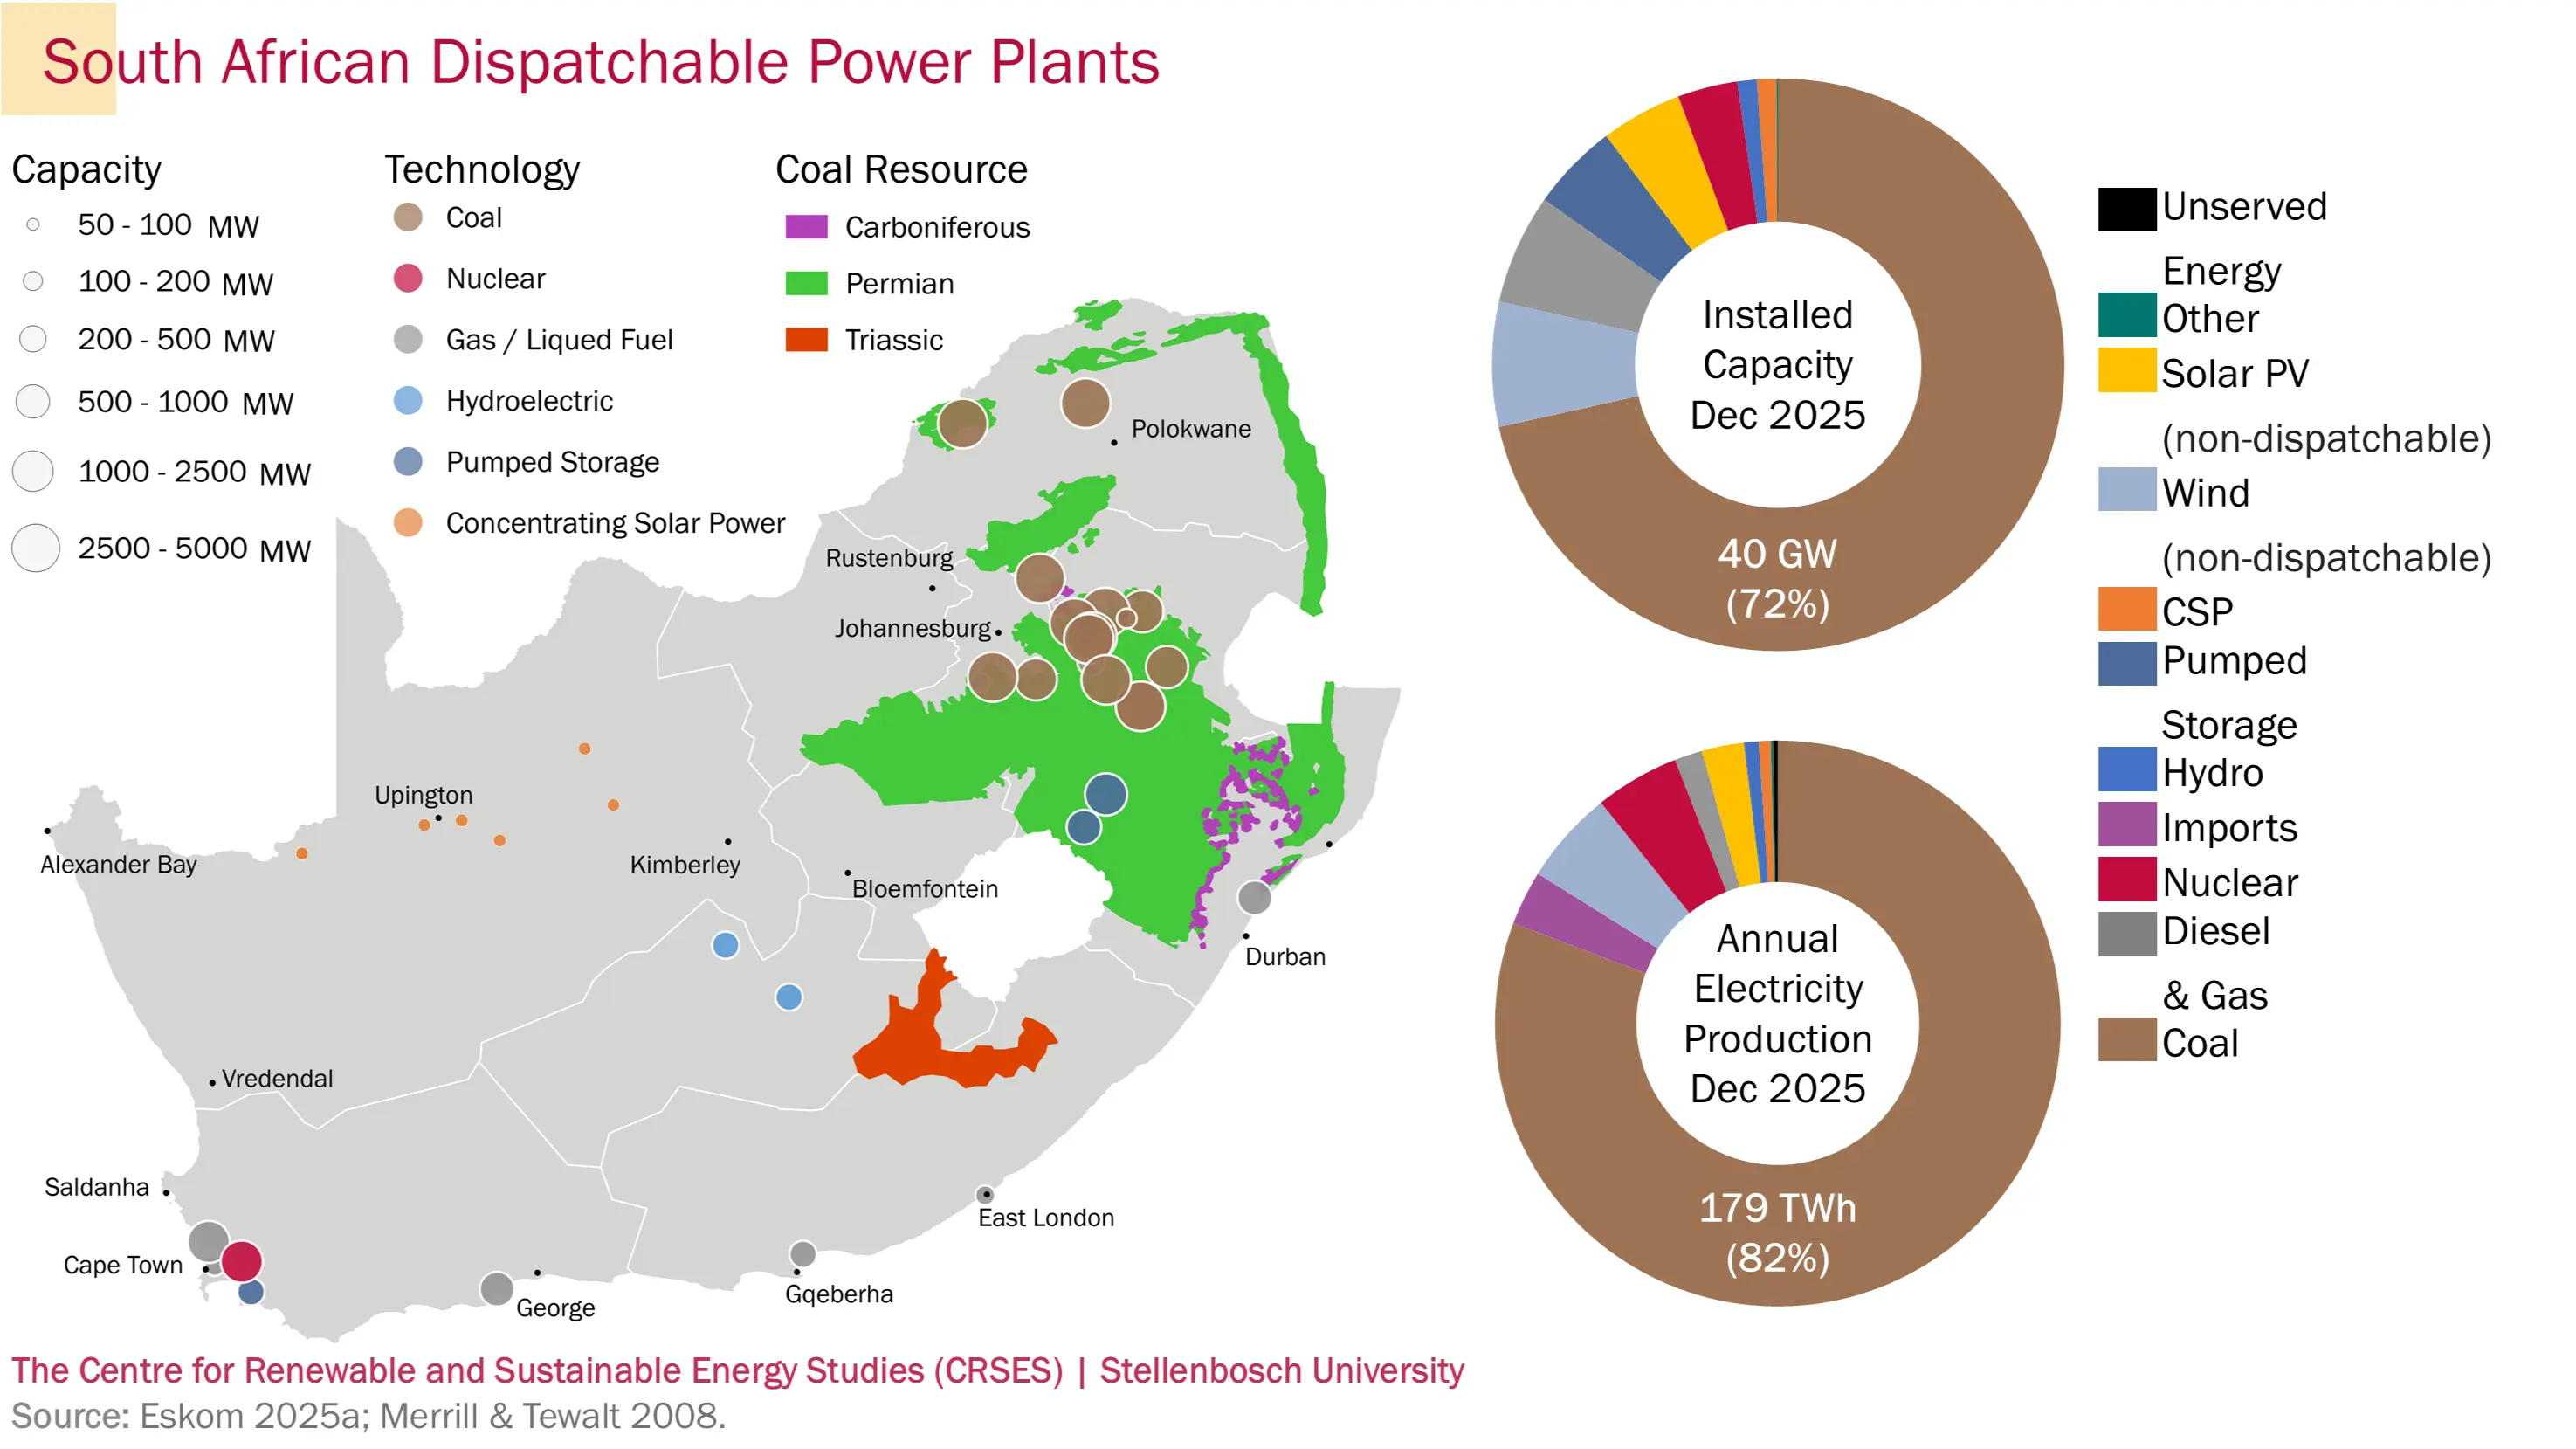
Dispatchable electricity generation in South Africa predominantly relies on coal, concentrated in the Mpumalanga region, which hosts the country's coalfields. South Africa's single nuclear power station is situated in the Western Cape near Cape Town, while pumped storage facilities are located in the mountainous regions of the Drakensberg and Kogelberg. As a water-constrained country, South Africa has limited hydroelectric resources. Additionally, the gas distribution infrastructure is underdeveloped, resulting in gas generation facilities being located primarily along the coast.
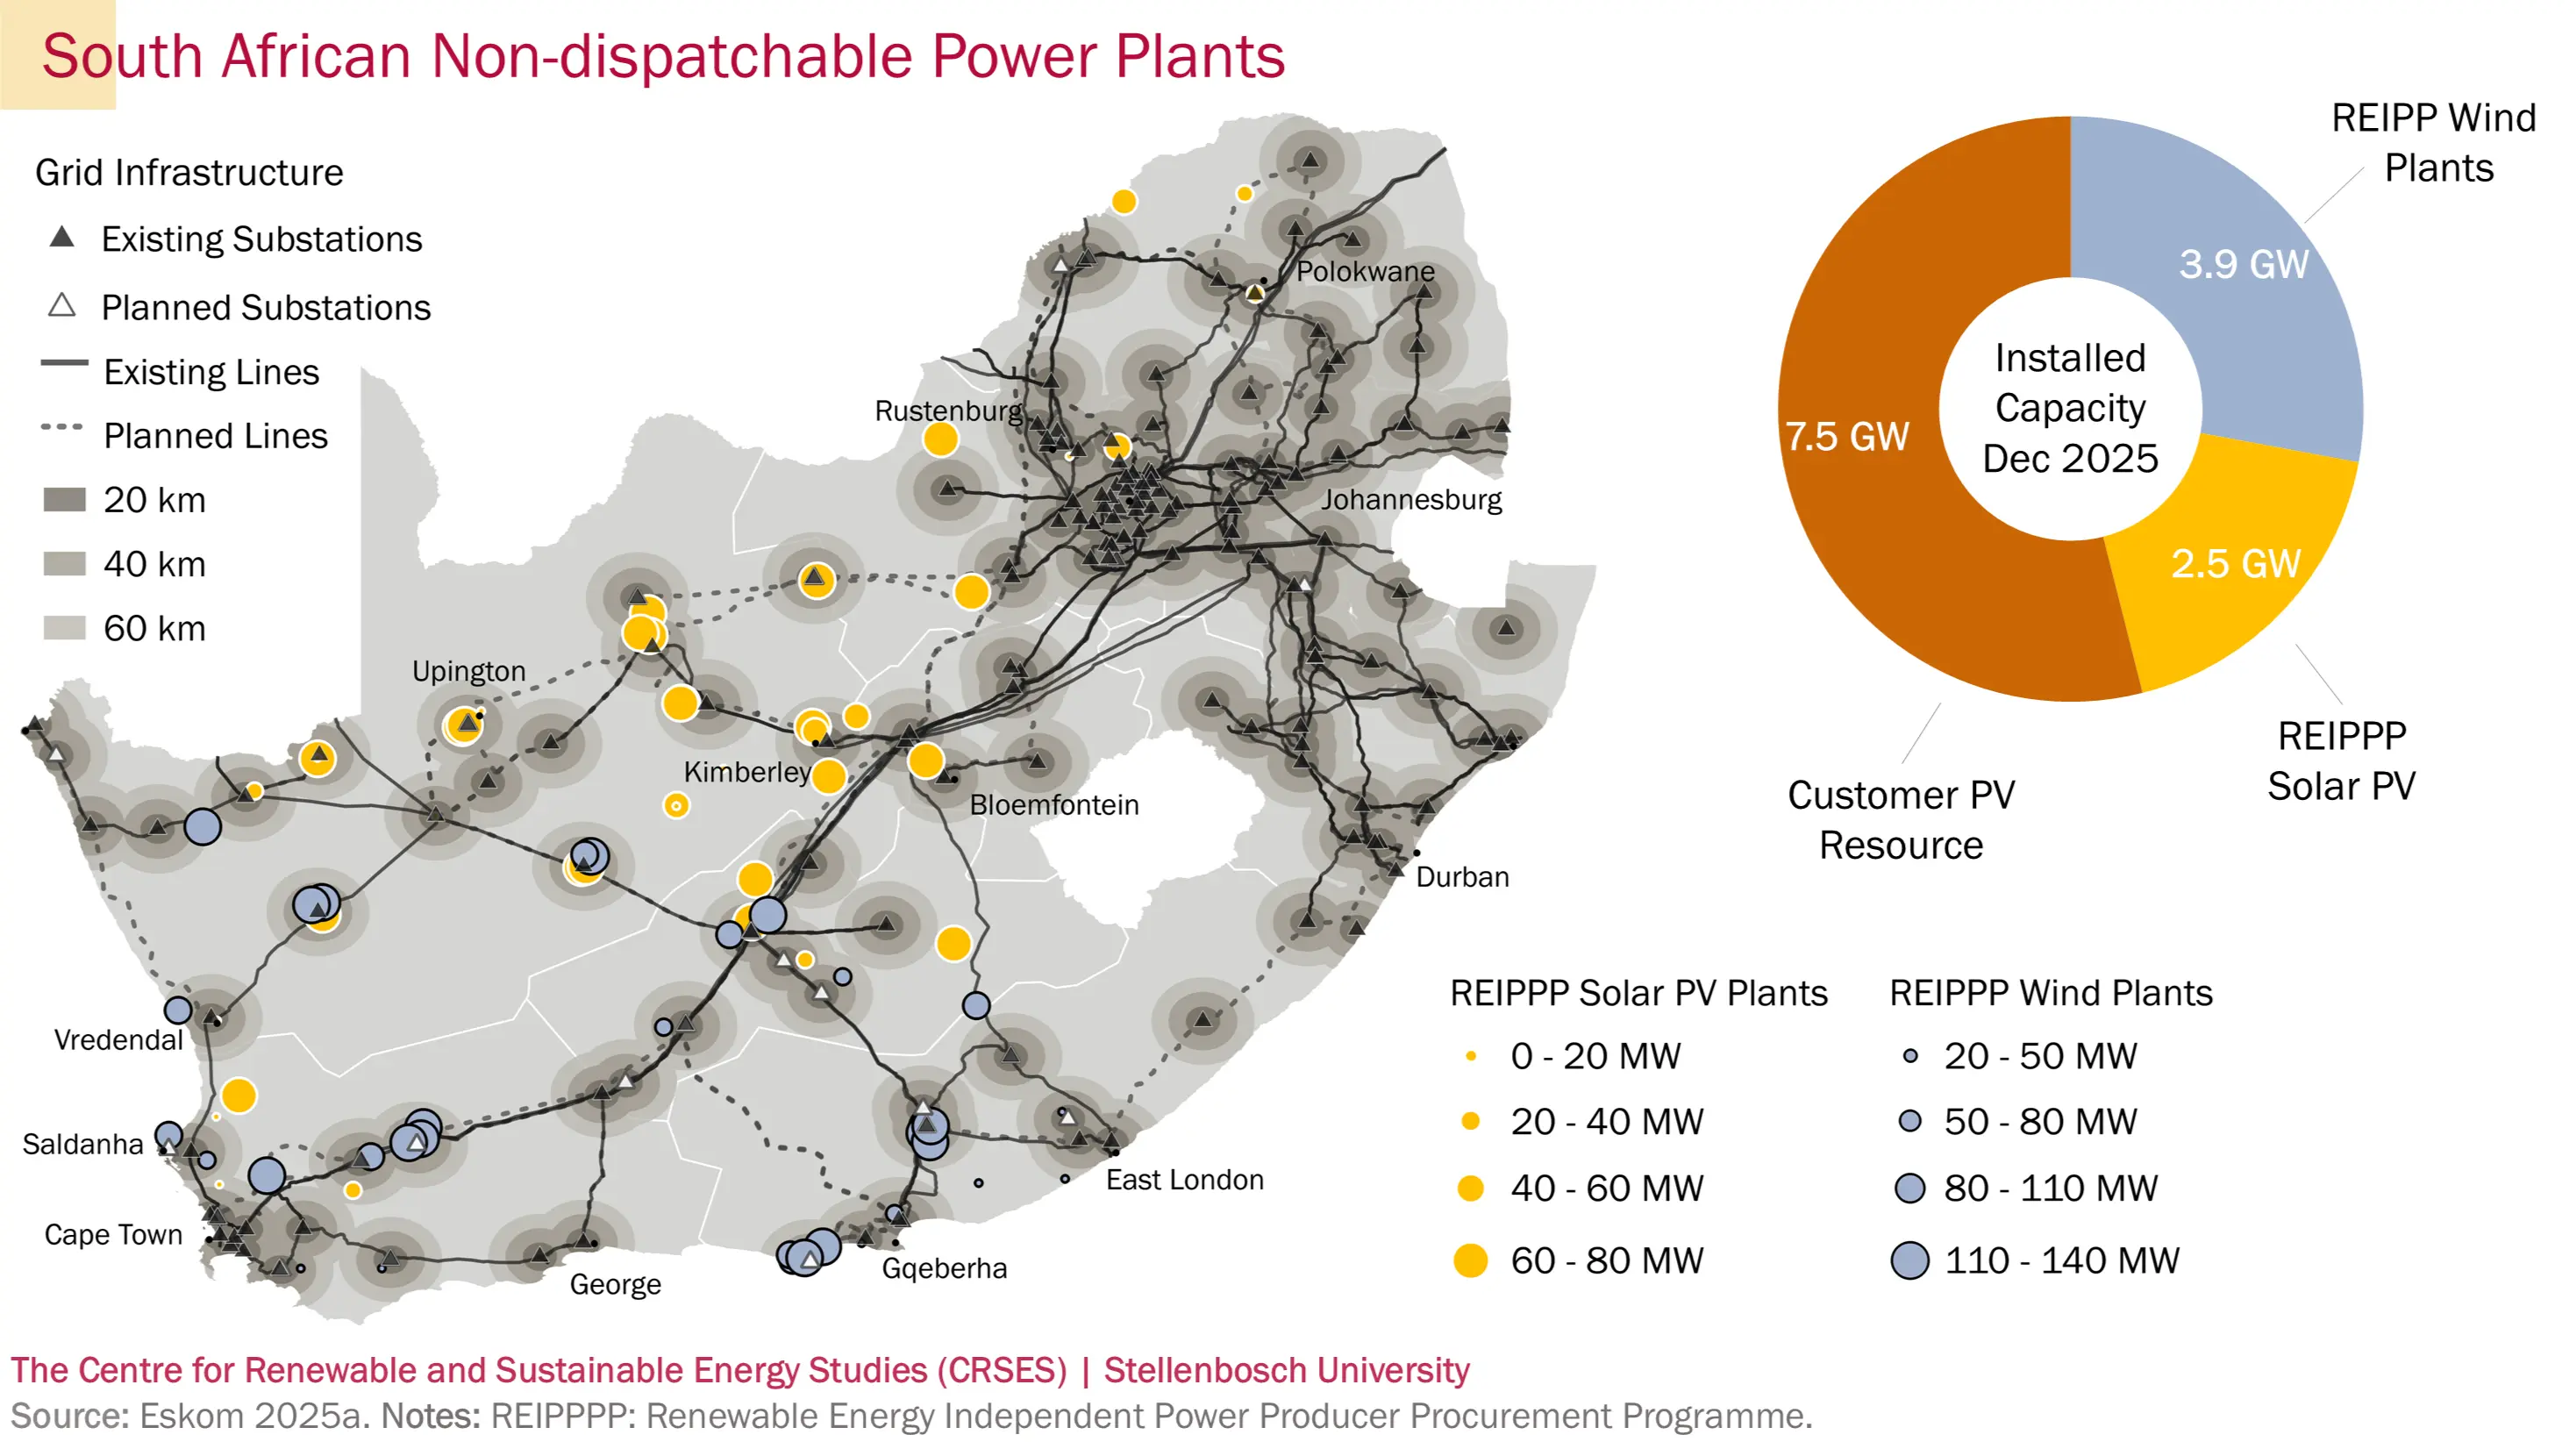
Non-dispatchable electricity in South Africa is generated mainly by solar photovoltaic (PV) and wind technologies. Most wind and around a quarter of the solar PV plants in South Africa have been installed through the Renewable Energy Independent Power Producer Procurement Programme (REIPPP), with the rest typically connected to the existing distribution grid and behind the customer's utility meter. Driven by cost considerations, the siting of utility-scale wind and PV plants is generally near a connection to the transmission grid. As shown in the picture below, the distance between current REIPPP plants and main transmission stations rarely exceeds 60km.
2. The Challenge of Constrained Generation in South Africa
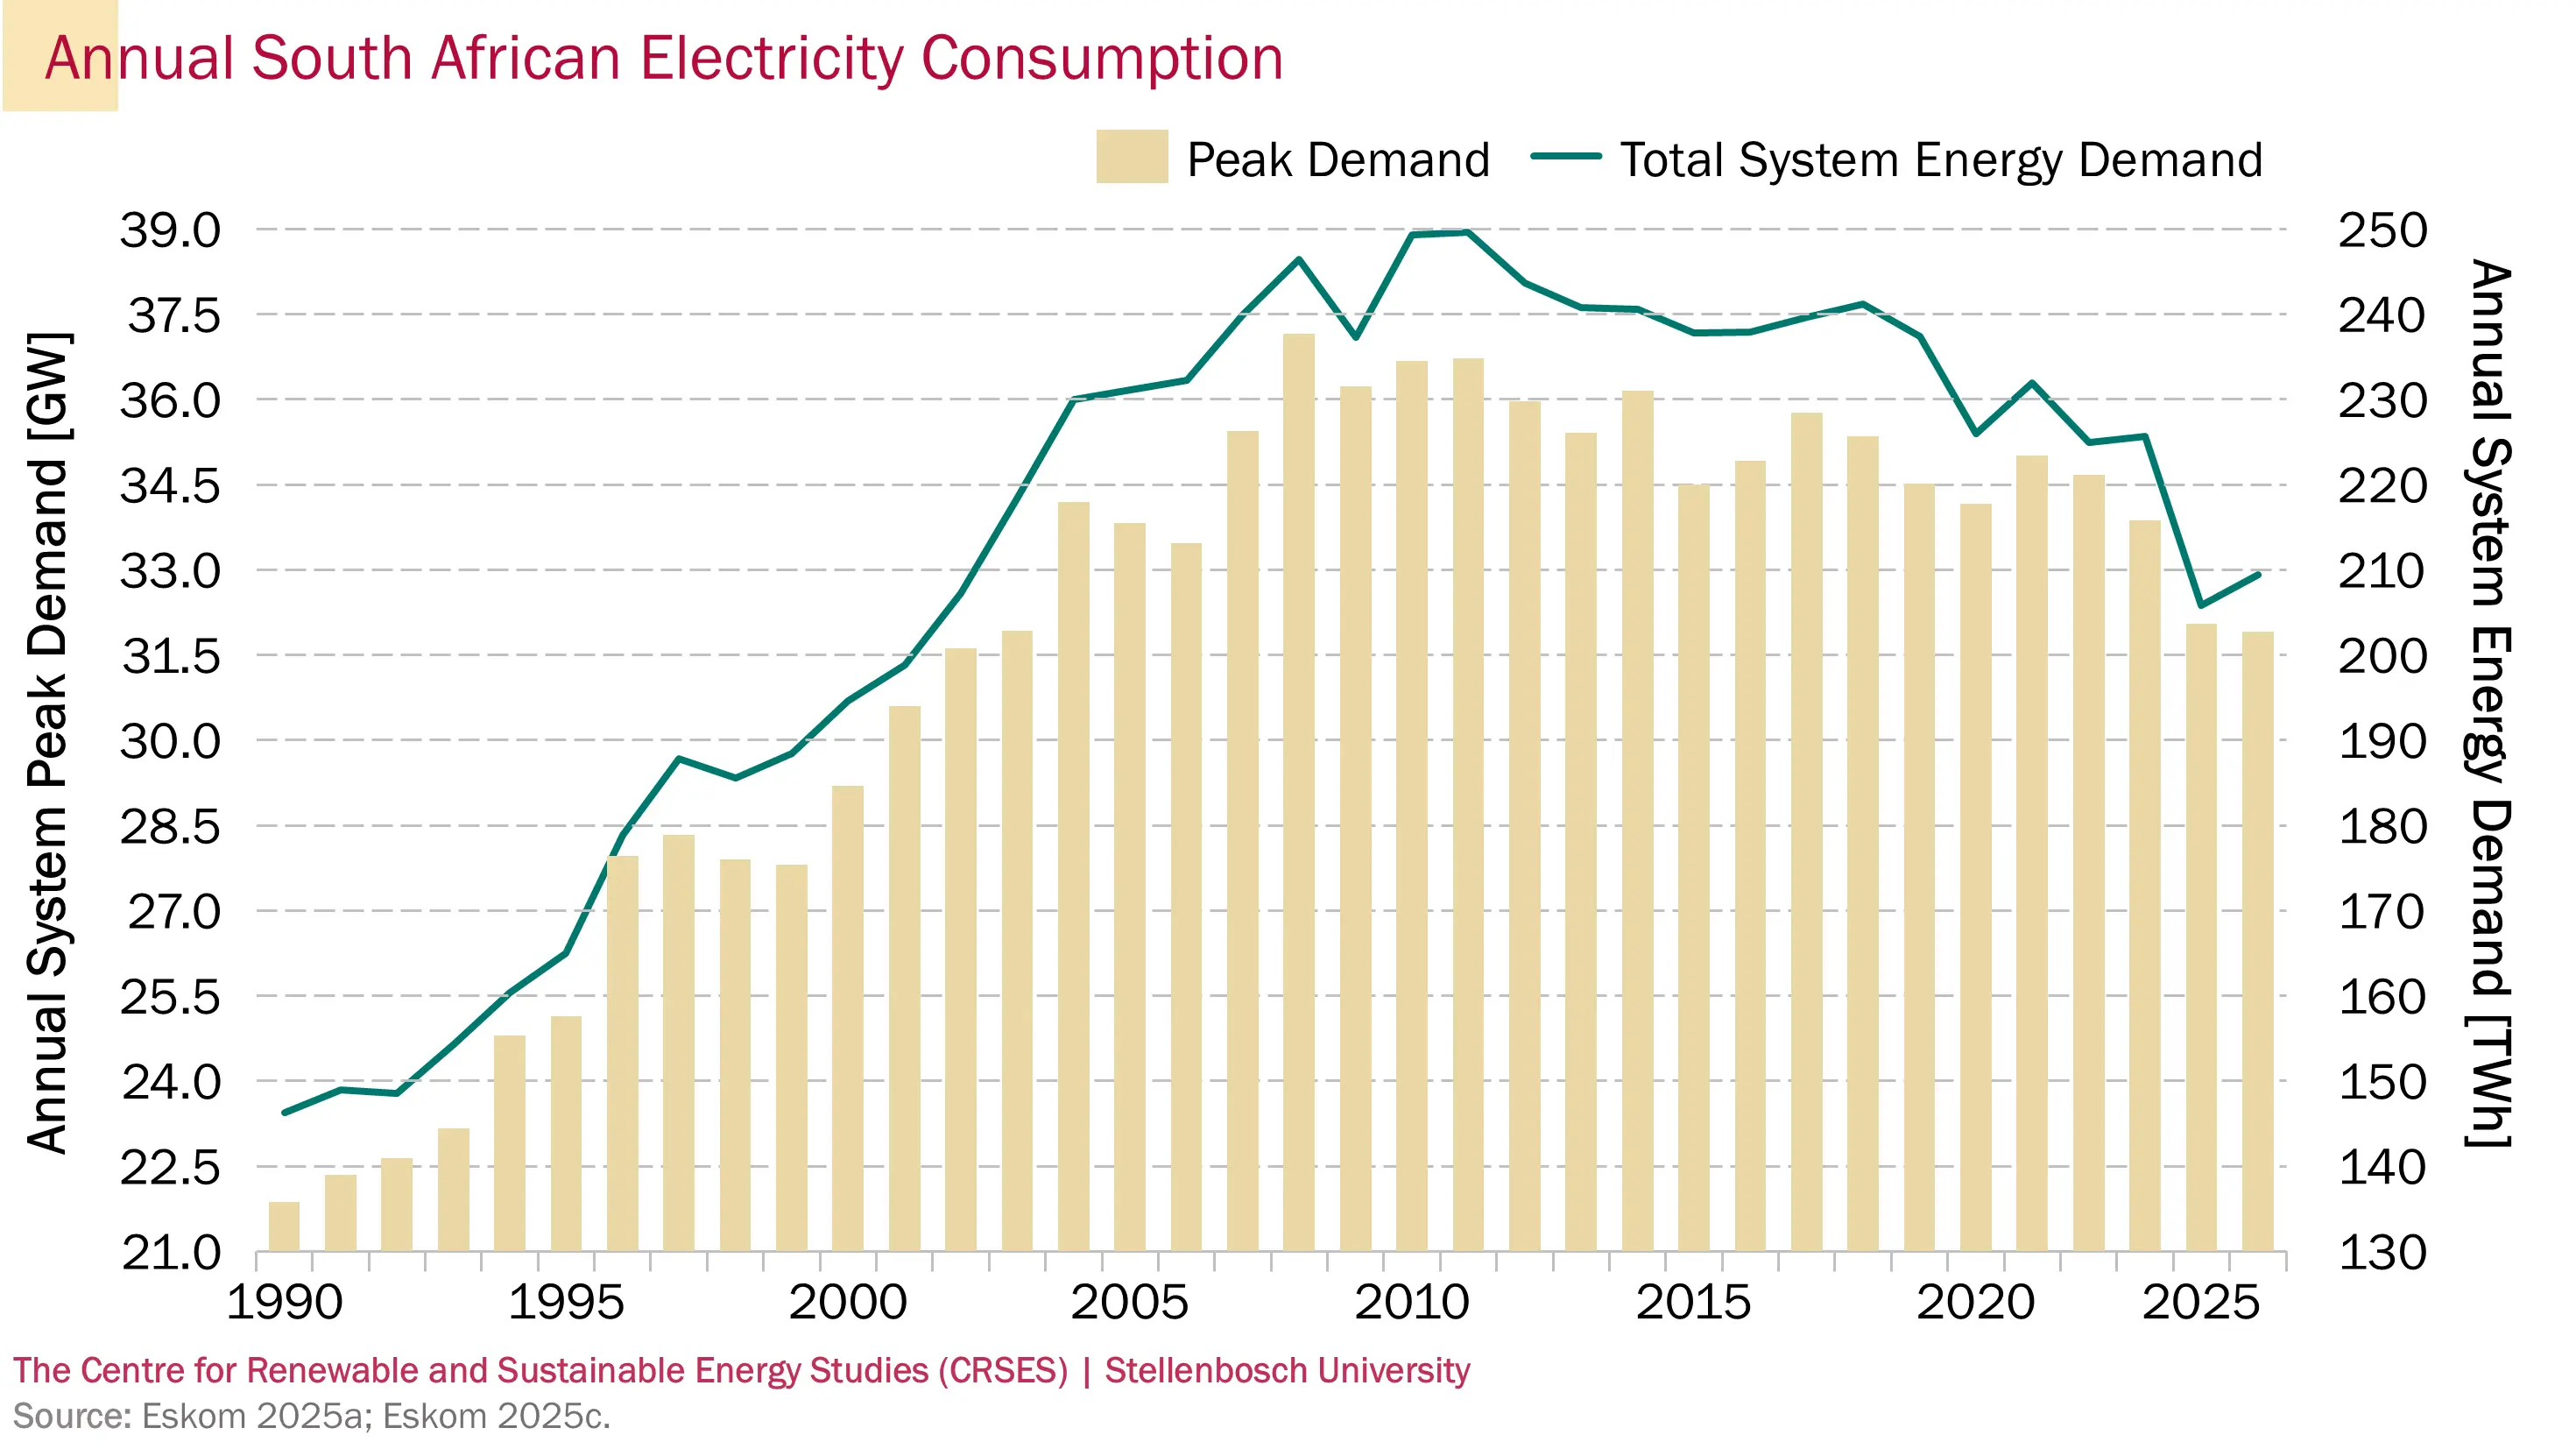
The diagram below provides a perspective of how South Africa's electricity consumption changed over time. Various factors influenced these changes, including South Africa's very successful electrification program which commenced in 1990, rising electricity prices, increasing appliance efficiency, and recurring load shedding since 2008.
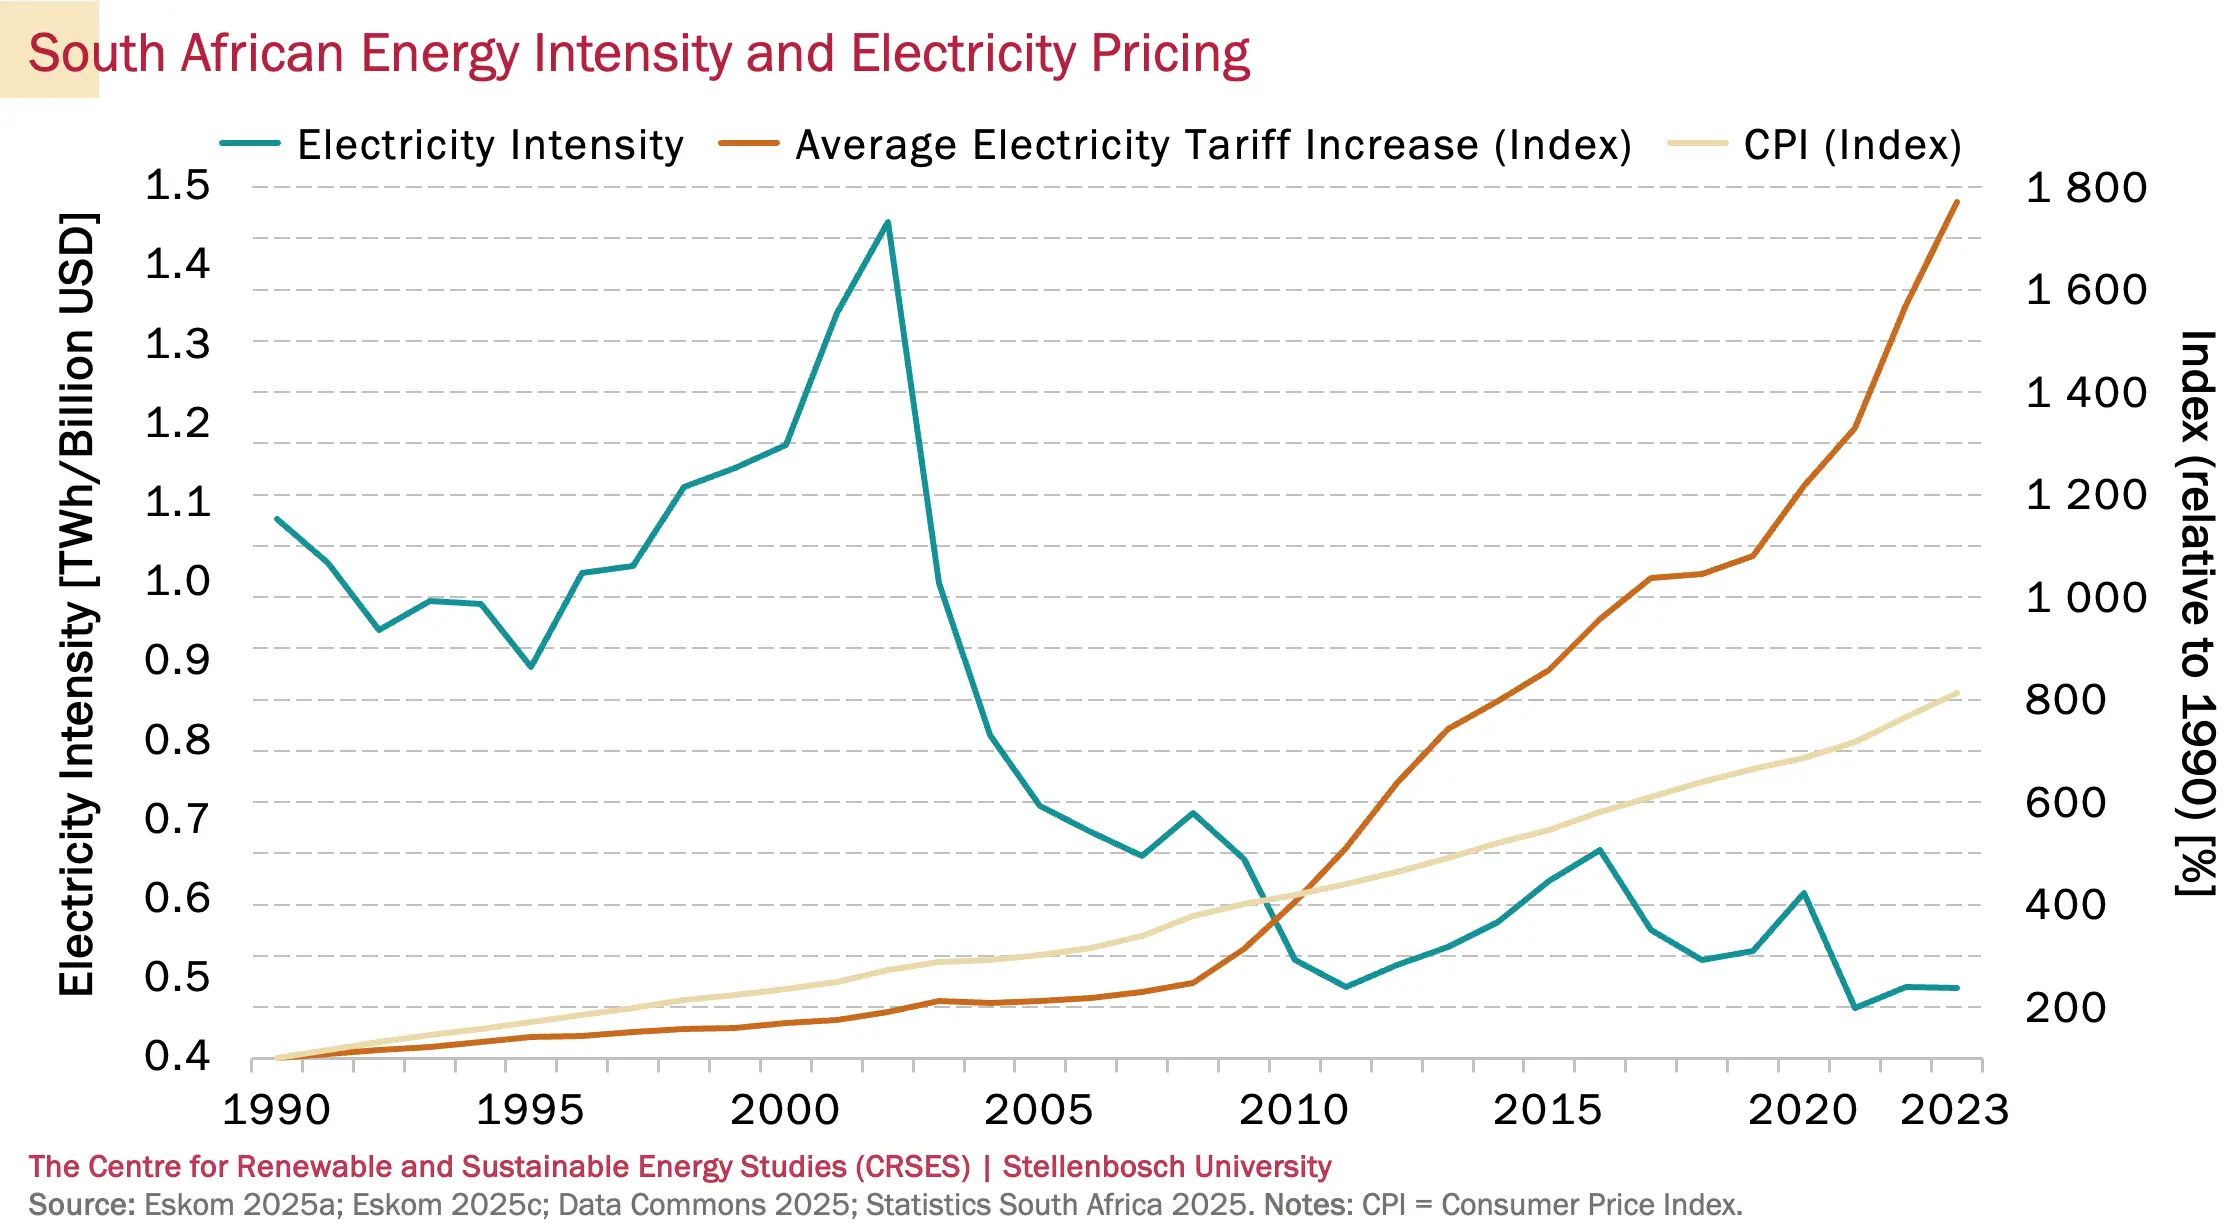
Electricity intensity measures the electrical energy used per gross domestic product (GDP). For South Africa, this declined sharply from 2002, mirroring an international trend towards more efficient electricity usage. South Africa saw a significant rise in electricity costs between 2008 and 2023 (720%), which far outpaced SA's inflation during the same period (215%), strongly incentivising more efficient electricity use and, from the mid-2010s, self-generation.
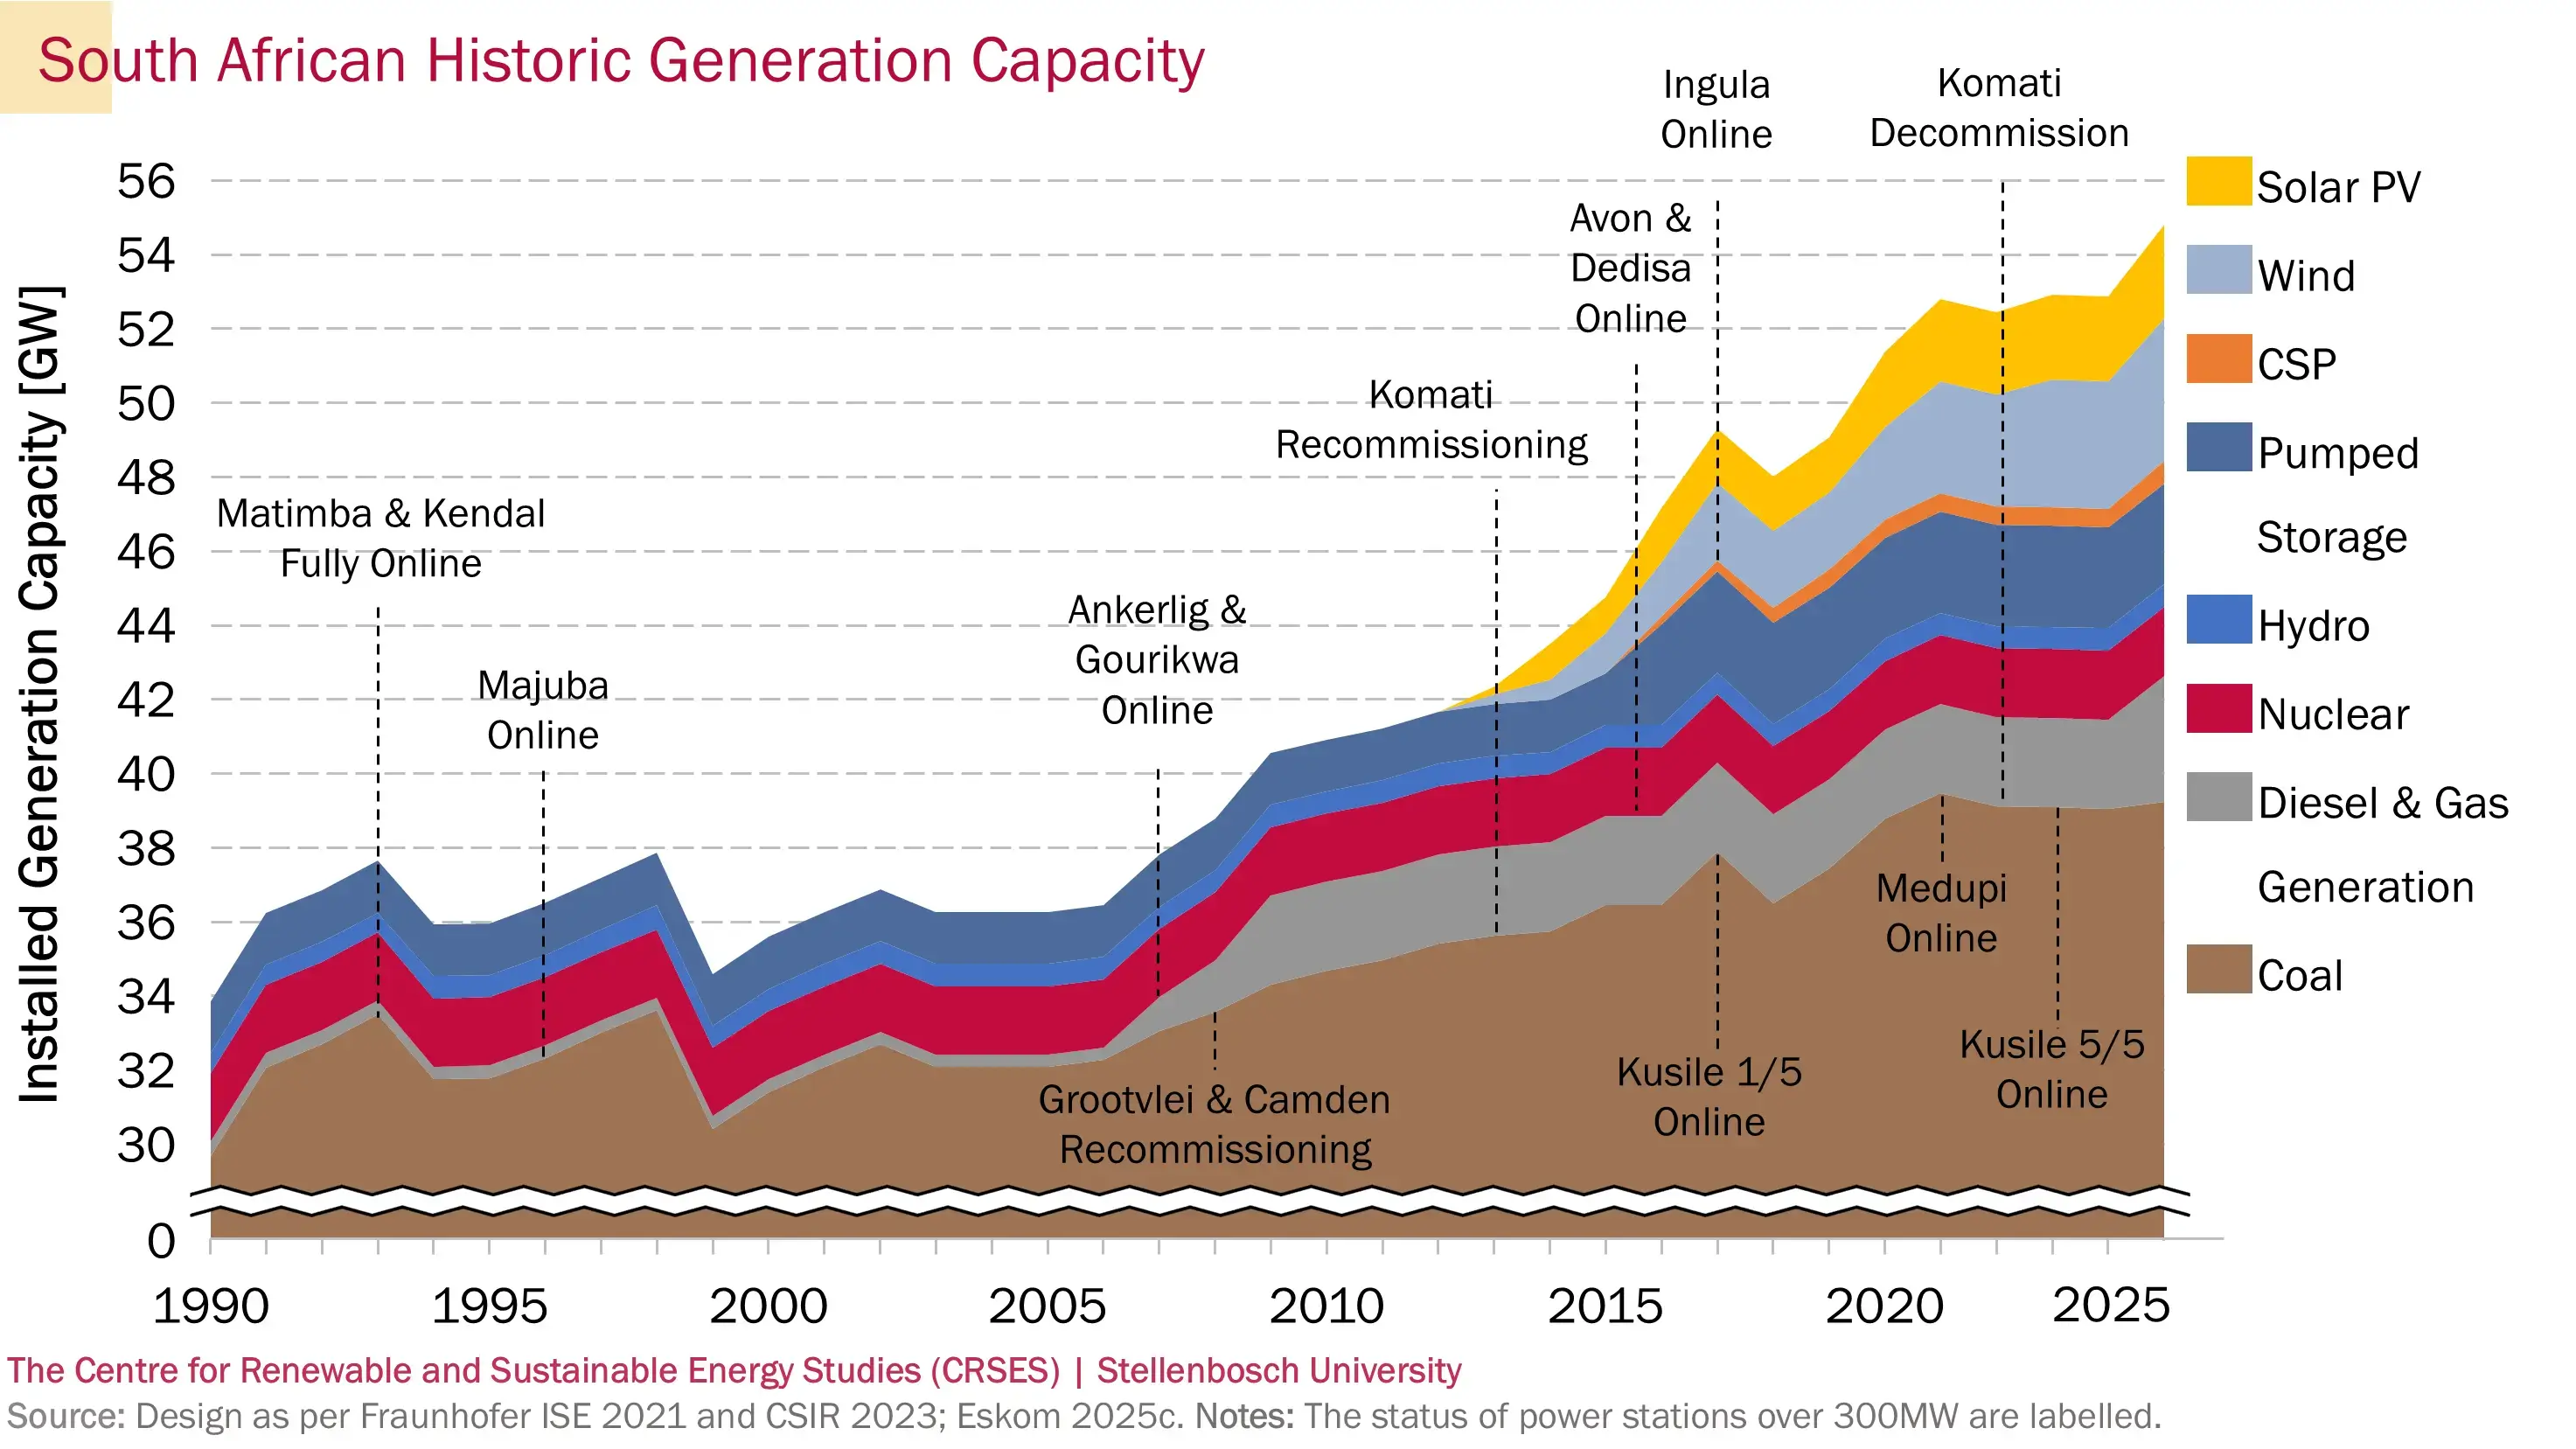
Although generation capacity has been sporadically added to the South African power system since 1990, the reserve margin has declined significantly from 1990 to 2024. The reserve margin measures the percentage of additional dispatchable generation capacity available above the annual peak demand for use in case of planned and unplanned generation outages and gives a good indication of the power system's resilience to unforeseen events.
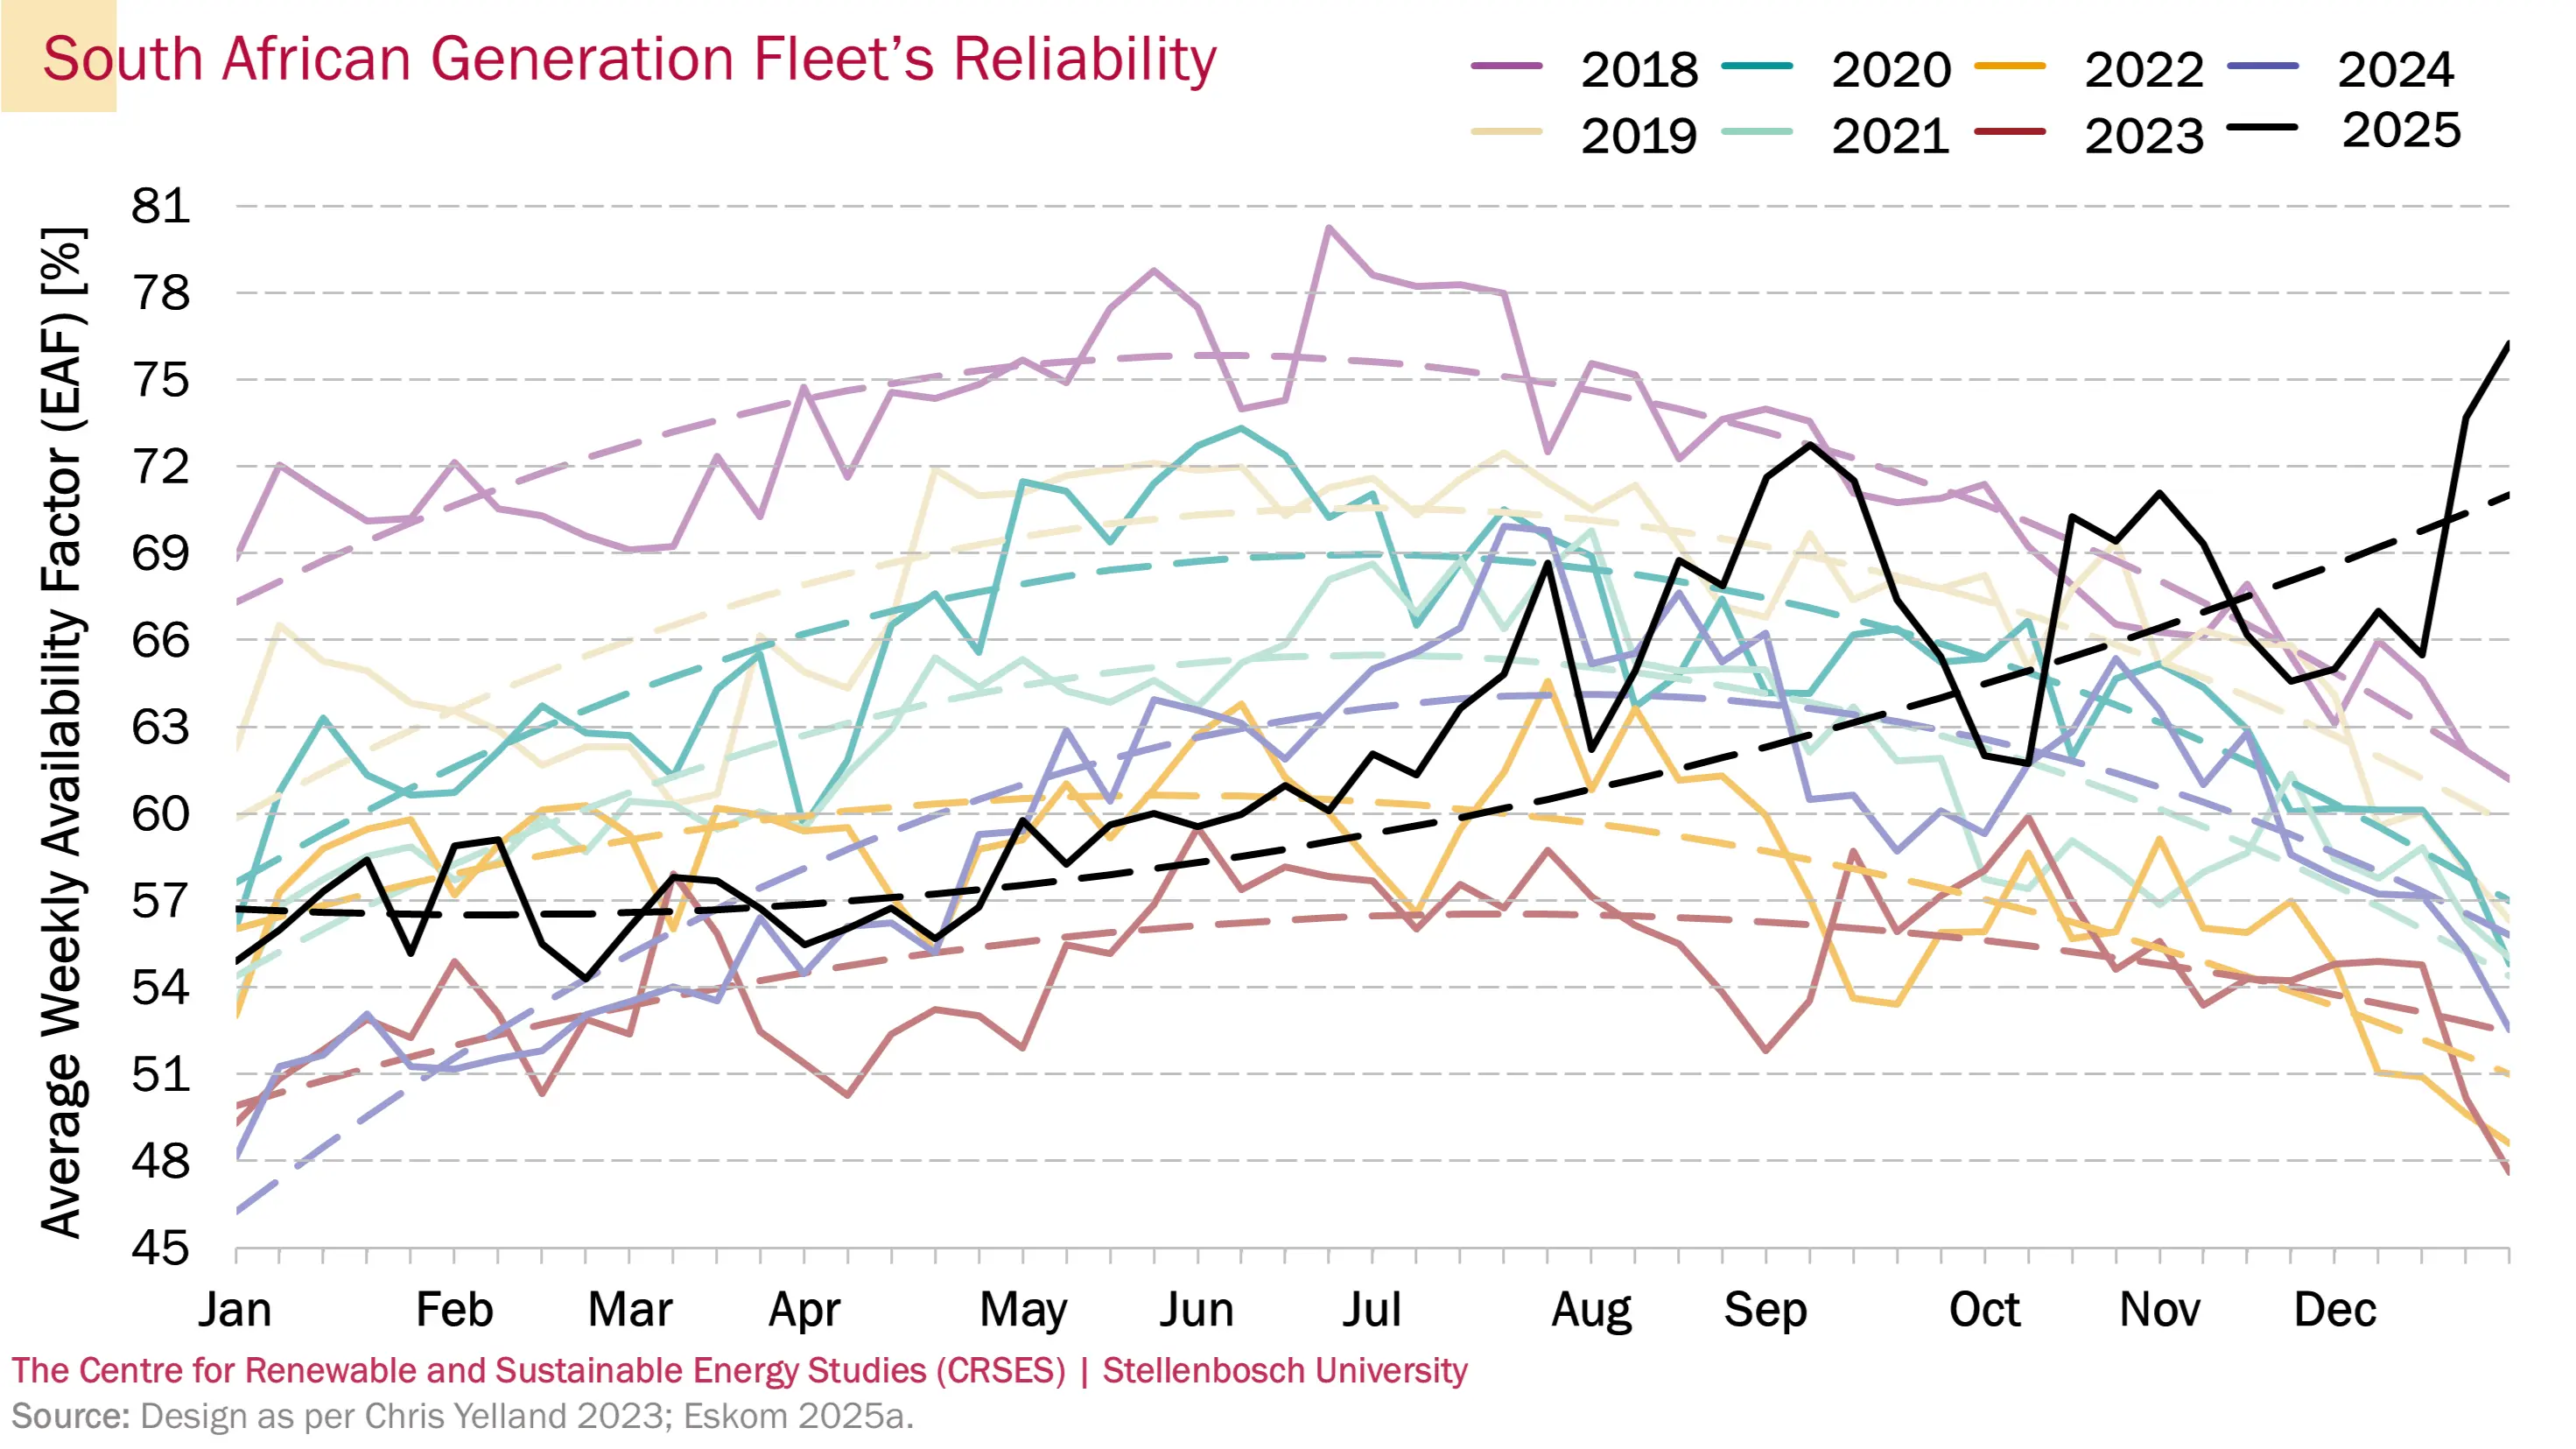
The reliability of South Africa's aging coal fleet declined drastically in recent years. Given coal's dominance in the energy mix, this impacted the reliability of the total South African generation fleet, as illustrated by the energy availability factor (EAF) graph below. EAF represents the amount of energy a generator was able to produce compared to its capacity over a period. As can be seen, EAF follows a seasonal trend informed by planned maintenance typically being scheduled during lower-demand summer periods, and more efficient coal plant operation during colder and dryer winter months. Noteworthy is how the EAF improved by July 2024, countering the declining trend of the preceding years and aiding in the reduction of load shedding.
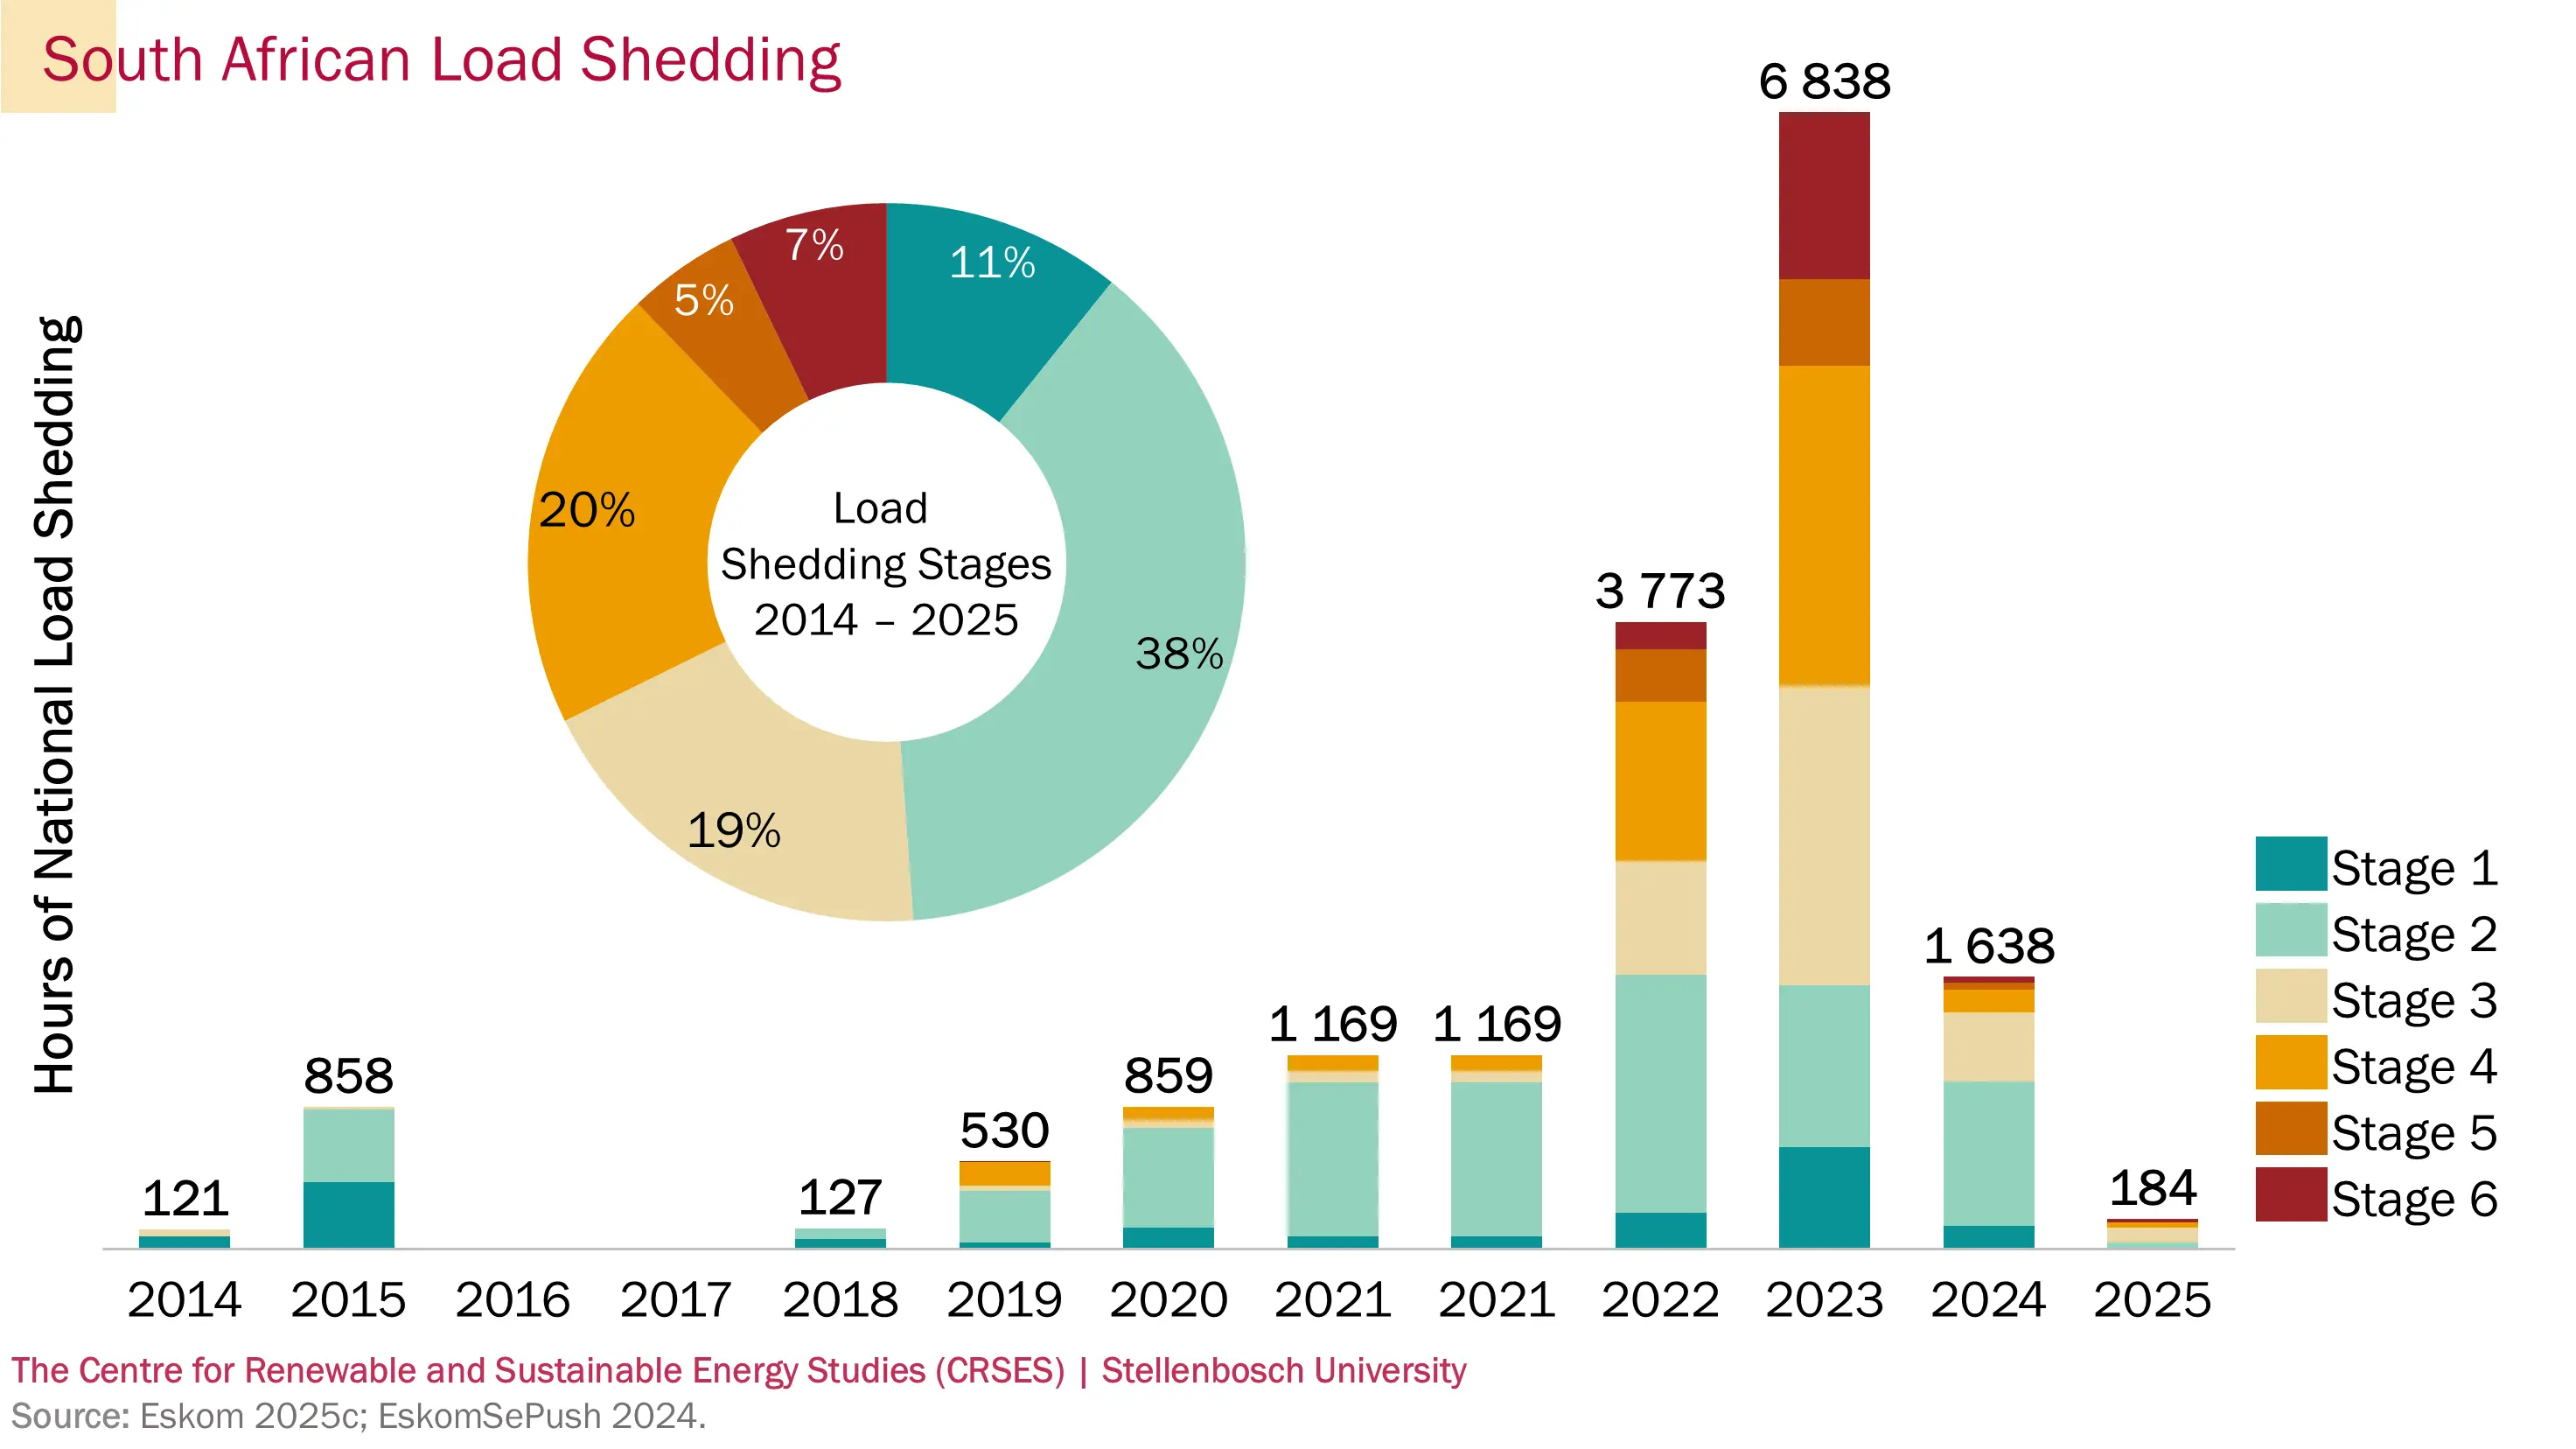
The combination of declining generation capacity and the increased unreliability of SA's coal fleet, ultimately made it impossible to satisfy the country's electricity demand at all times. From 2008 this resulted in scheduled, stage-based national load reduction known as load shedding. Eight stages of load shedding were defined, with stage 1 resulting in the reduction of 1 GW of demand nationally, stage 2 in 2 GW, etc. Load shedding has been increasing exponentially in recent years, but saw a drastic improvement in 2024.
3. The Rise of Renewable Energy in South Africa
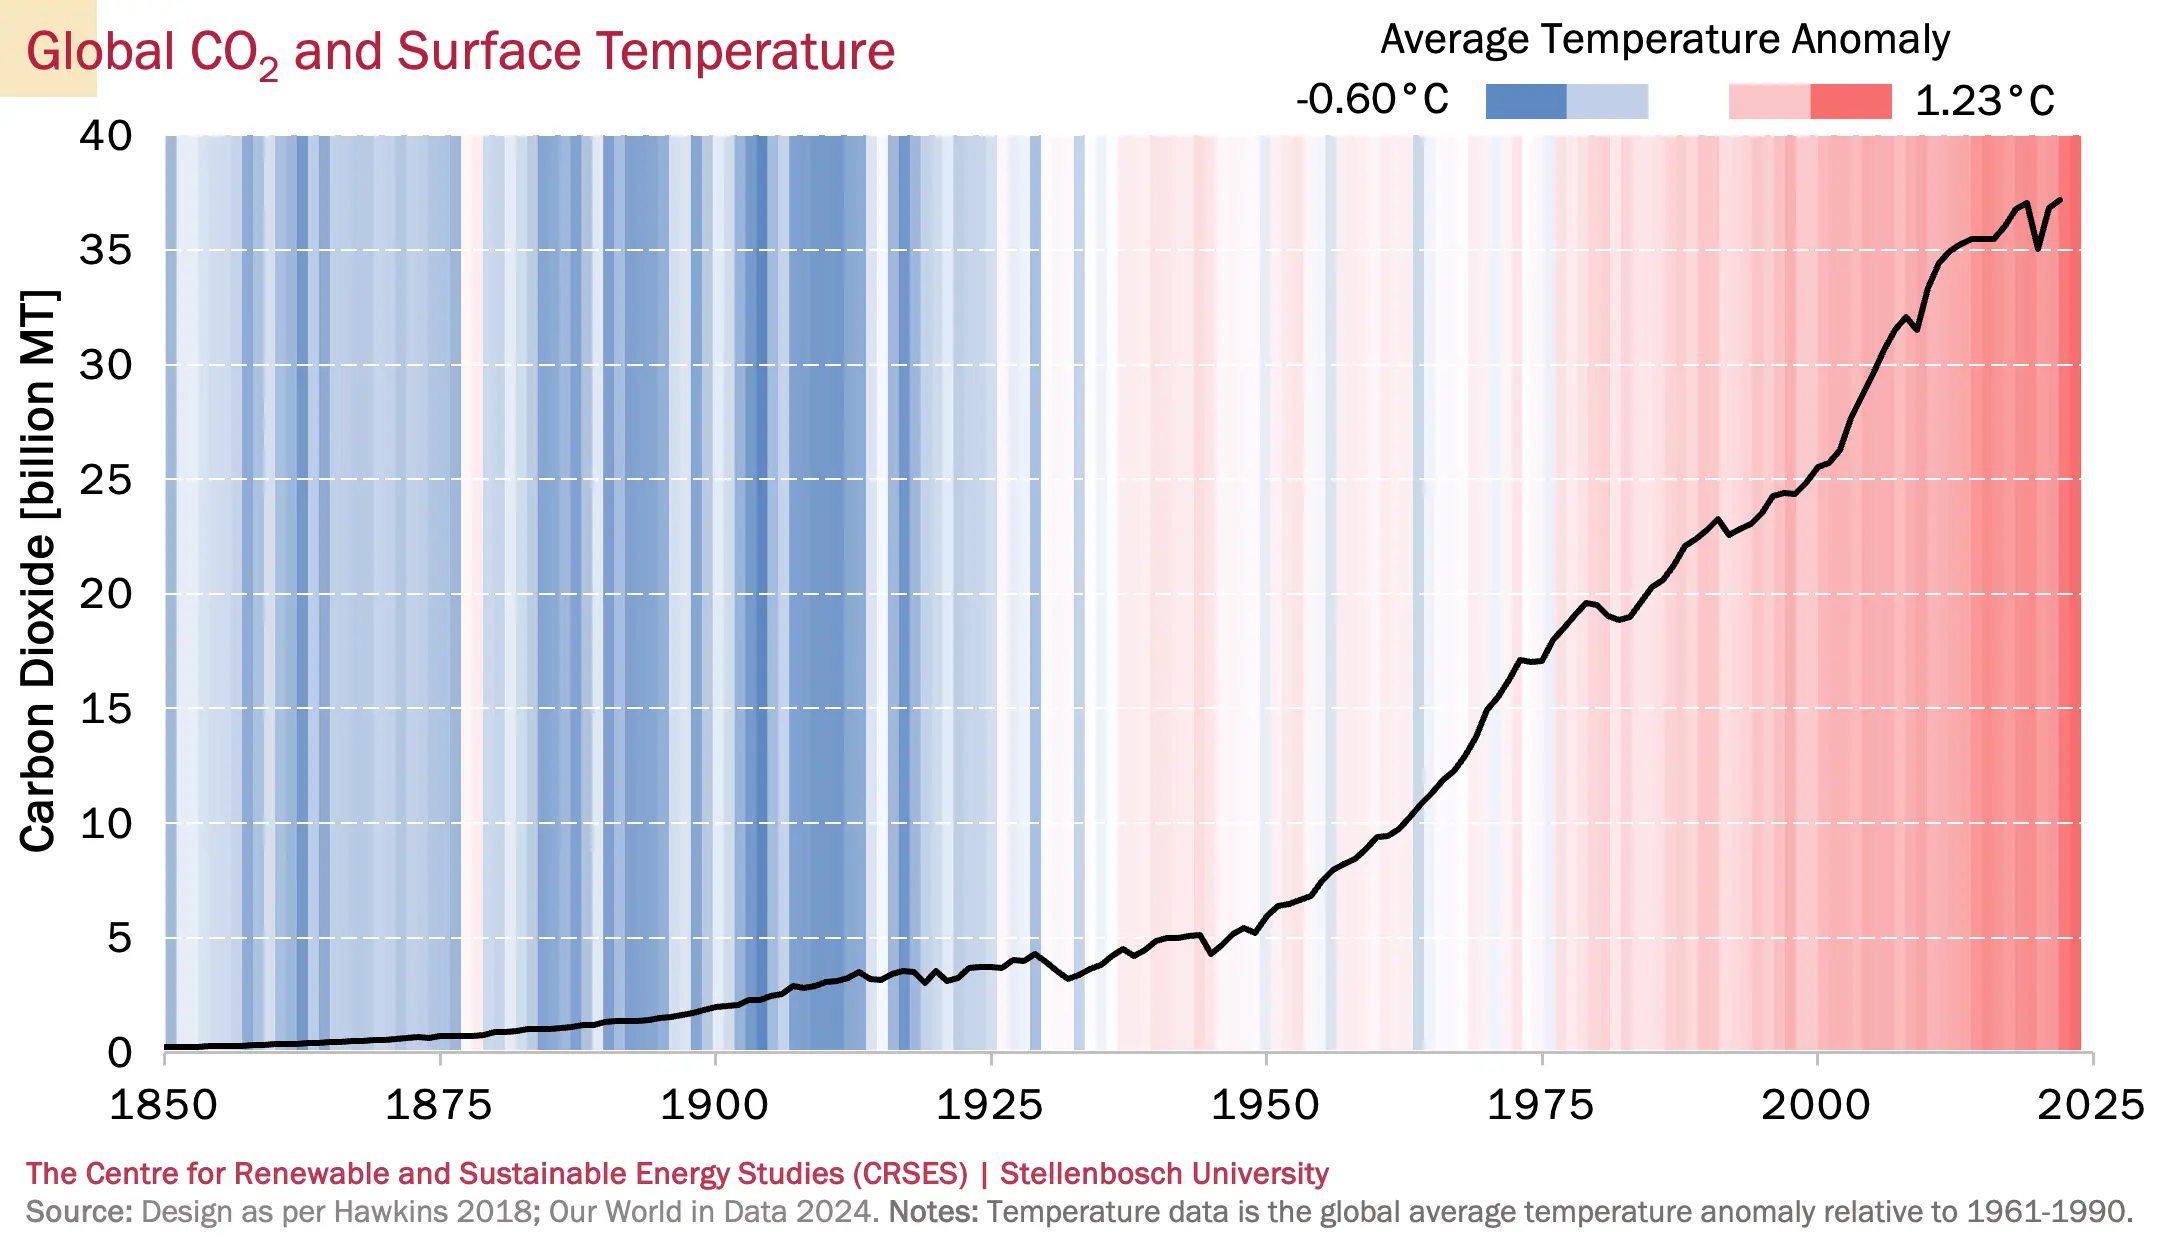
The strong correlation between rising global CO₂ levels and increasing surface temperatures highlights the urgent need for renewable energy adoption. South Africa, with its heavy reliance on coal-fired power, has recognized the environmental and economic risks associated with fossil fuels. As a result, the country has implemented policies such as the Renewable Energy Independent Power Producer Procurement Programme (REIPPPP) to accelerate the transition to cleaner energy sources like solar and wind. By reducing its carbon footprint and mitigating climate change impacts, South Africa aims to align with global sustainability goals while addressing its energy security challenges.
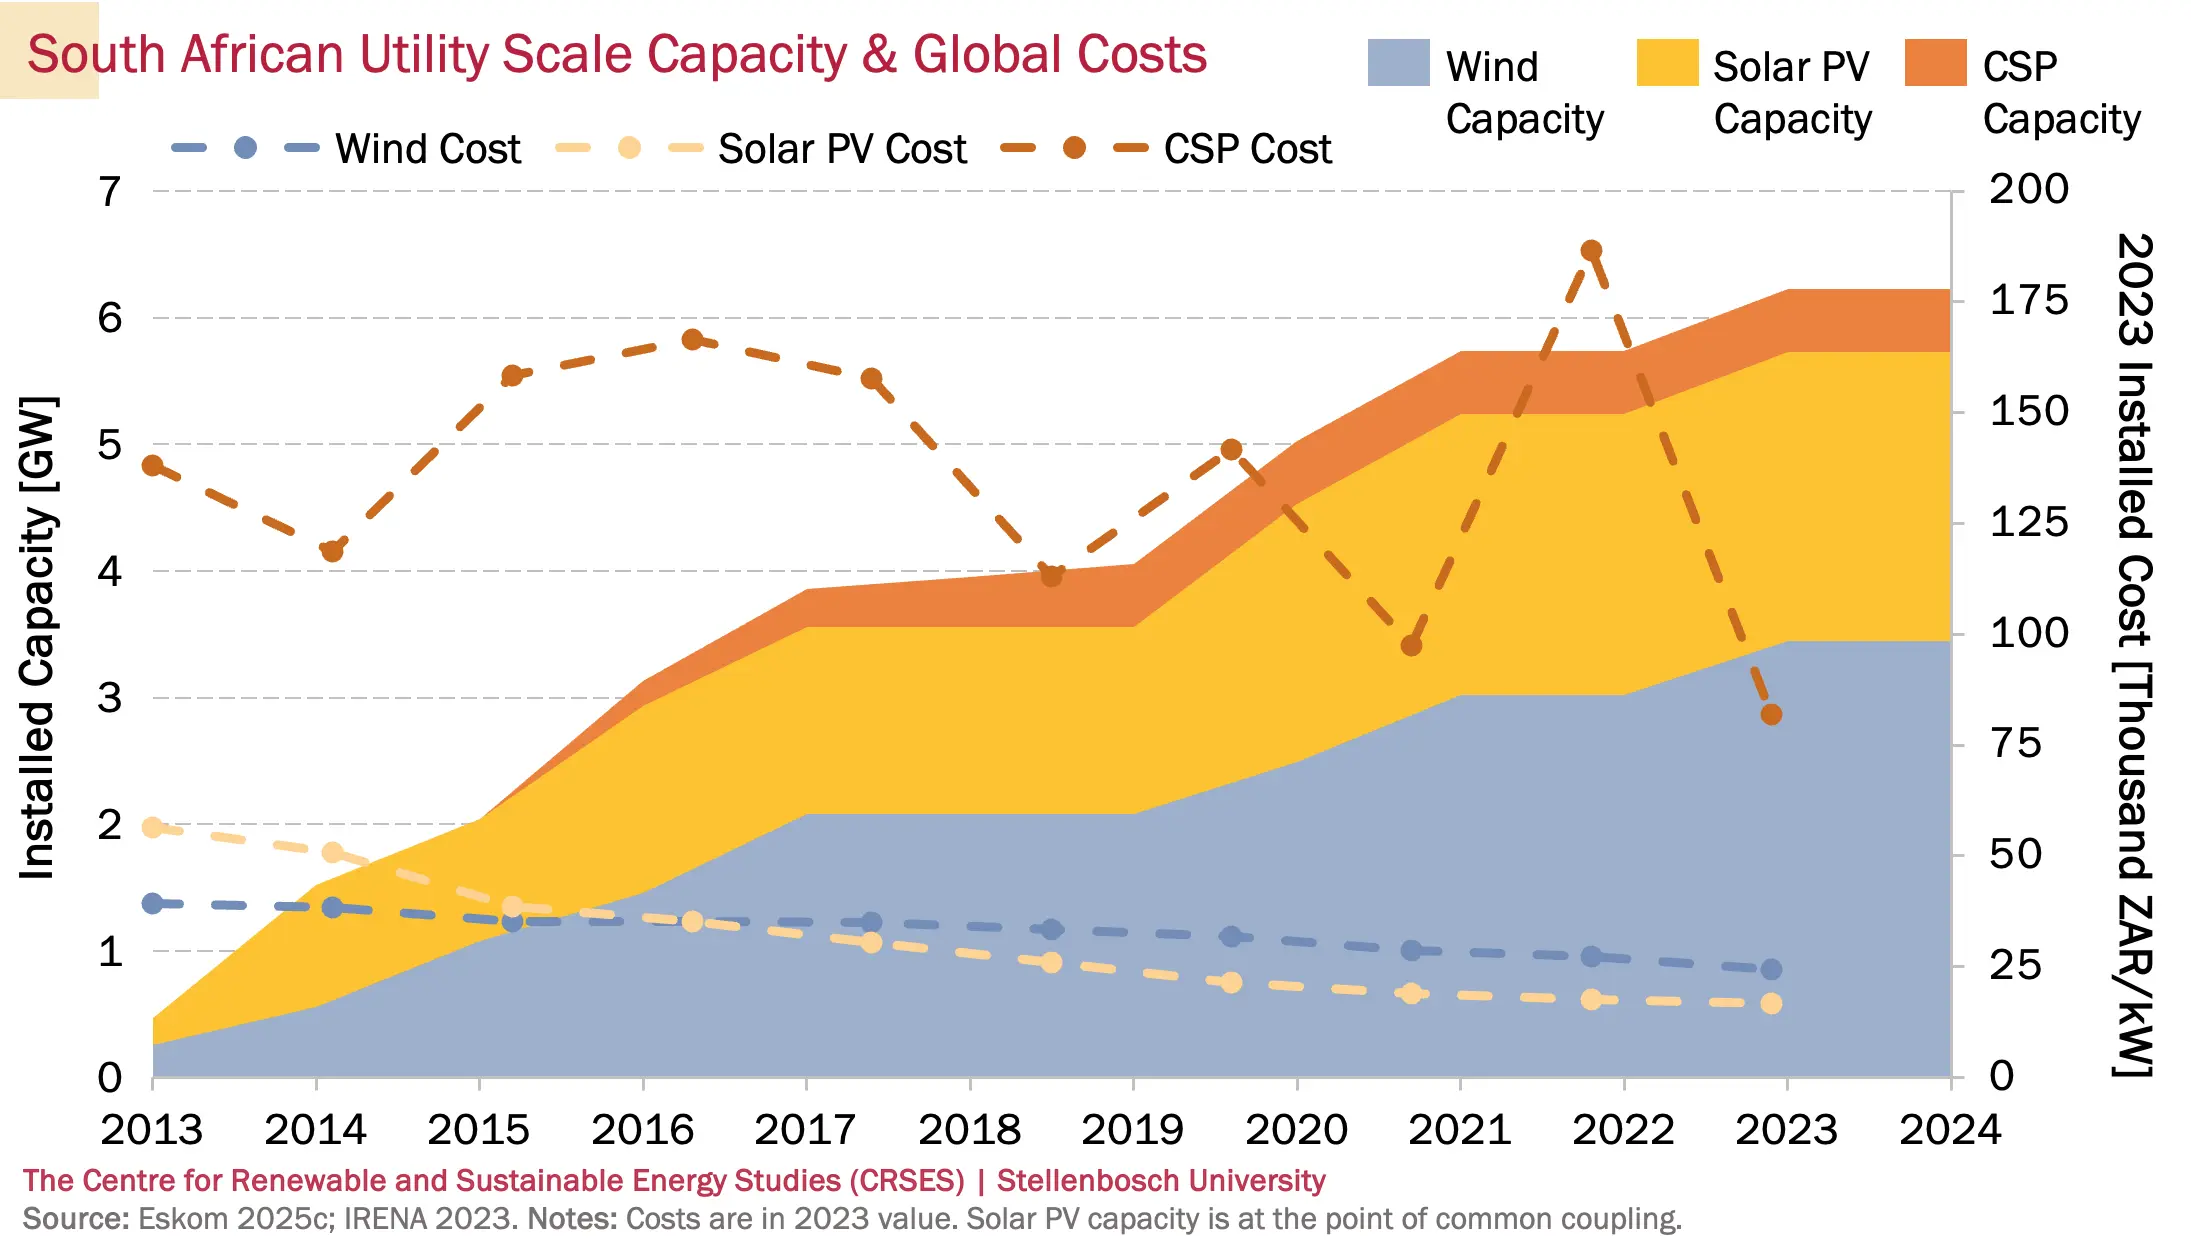
Renewable energy installed capacity and energy production are increasing in South Africa, but still constitute a small portion of the total capacity and energy mix. Concentrating solar power (CSP) costs are high and have more variability than wind and solar PV costs, which are both on a stable downward trend.
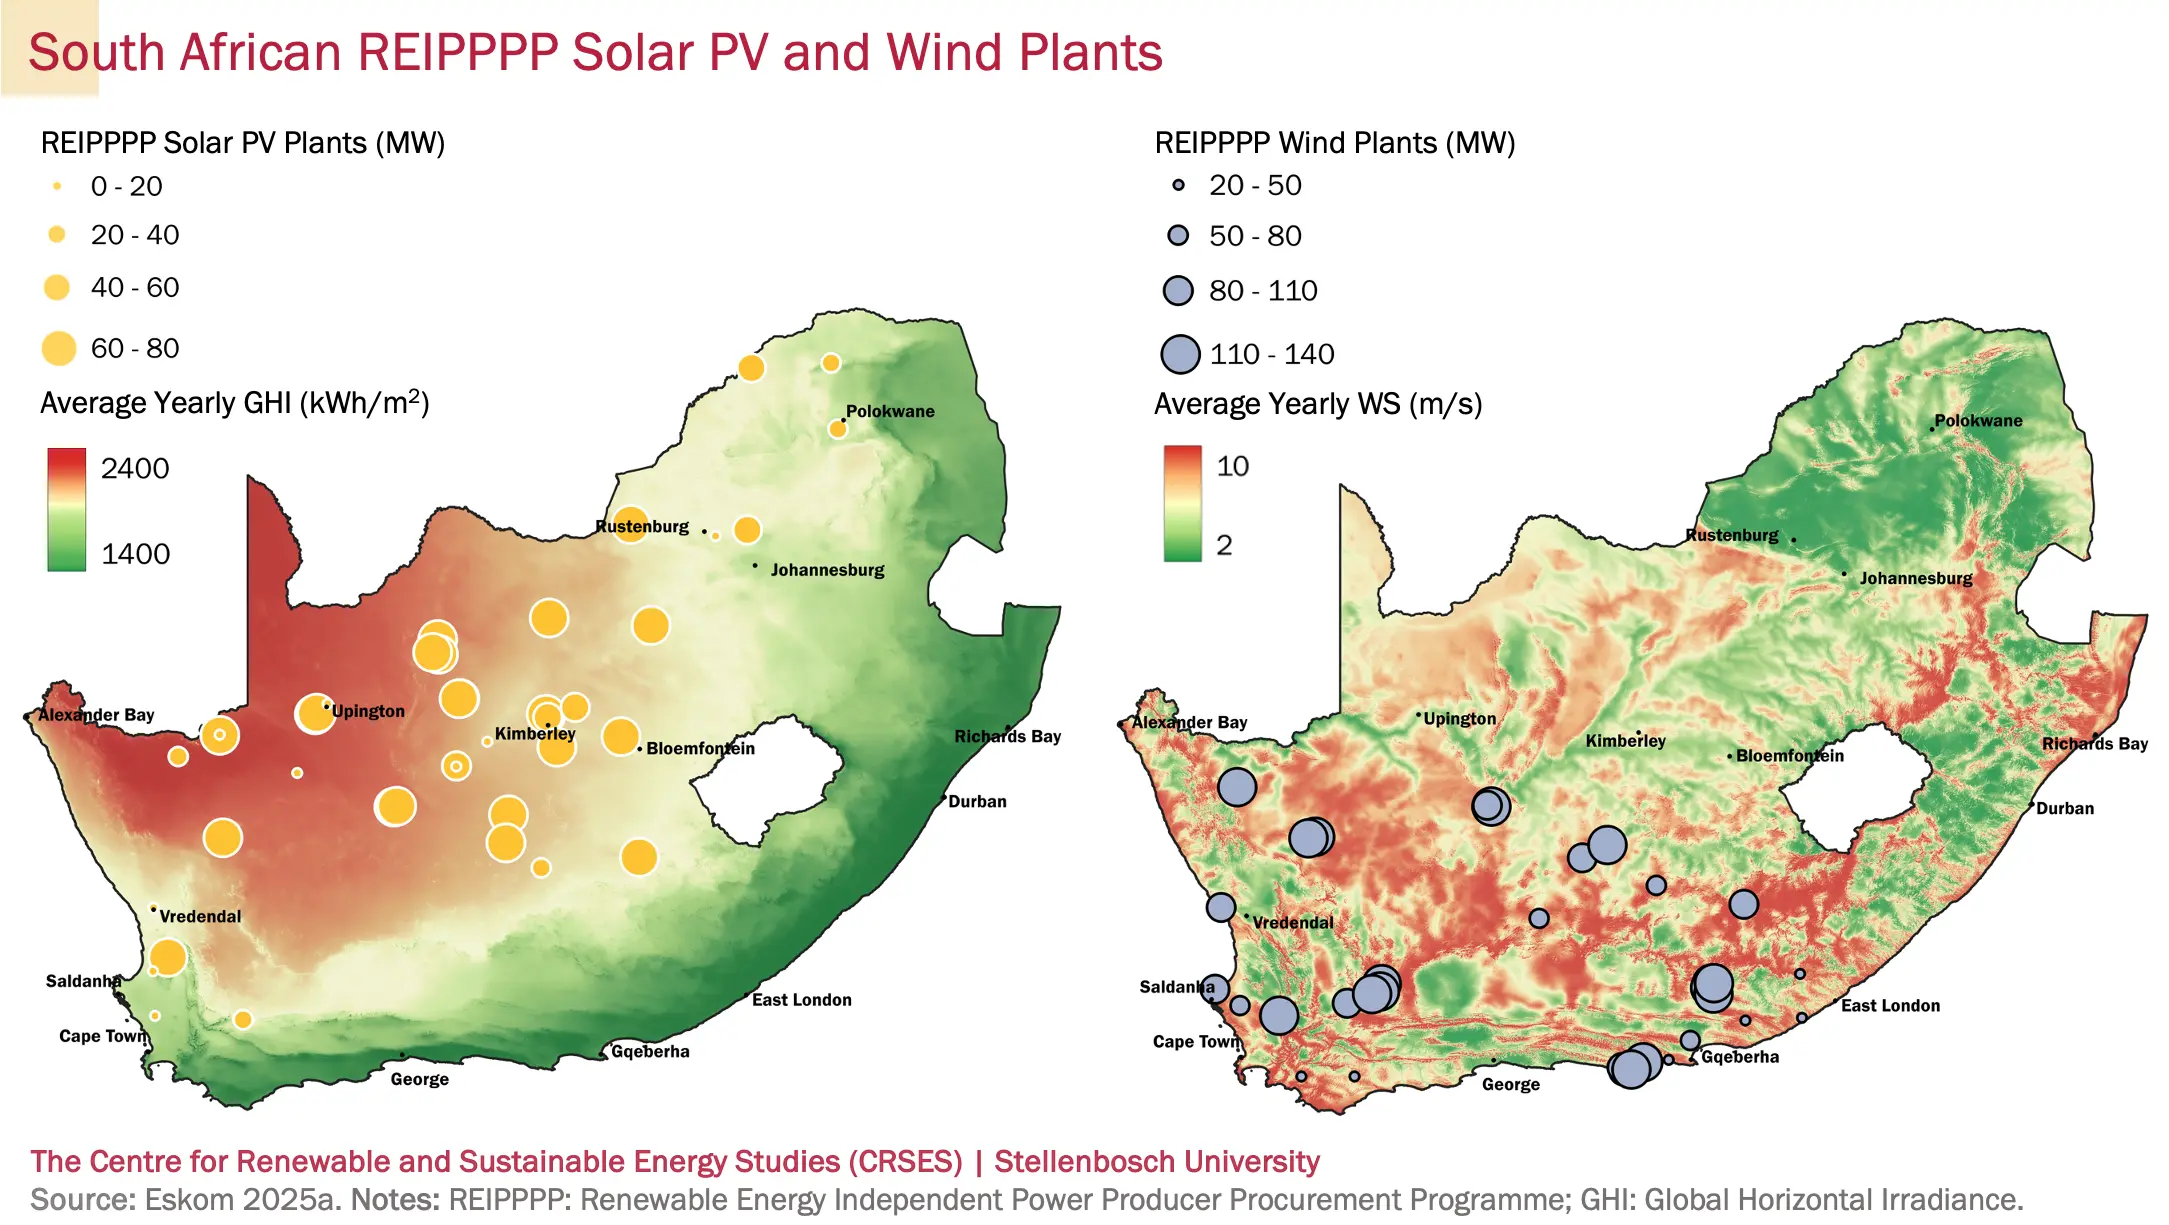
Utility-scale wind and solar PV projects procured during bid windows 1 to 6 of the Renewable Energy Independent Power Producer Procurement Programme (REIPPPP) were selected based on the lowest cost per unit of energy produced, without consideration for the time of day or season in which the energy was generated. Consequently, the geospatial distribution of the resulting wind and PV plants align with areas in South Africa that have the highest wind speeds and solar irradiation, as illustrated in the following image.
Here are a few definitions for the sections to follow:
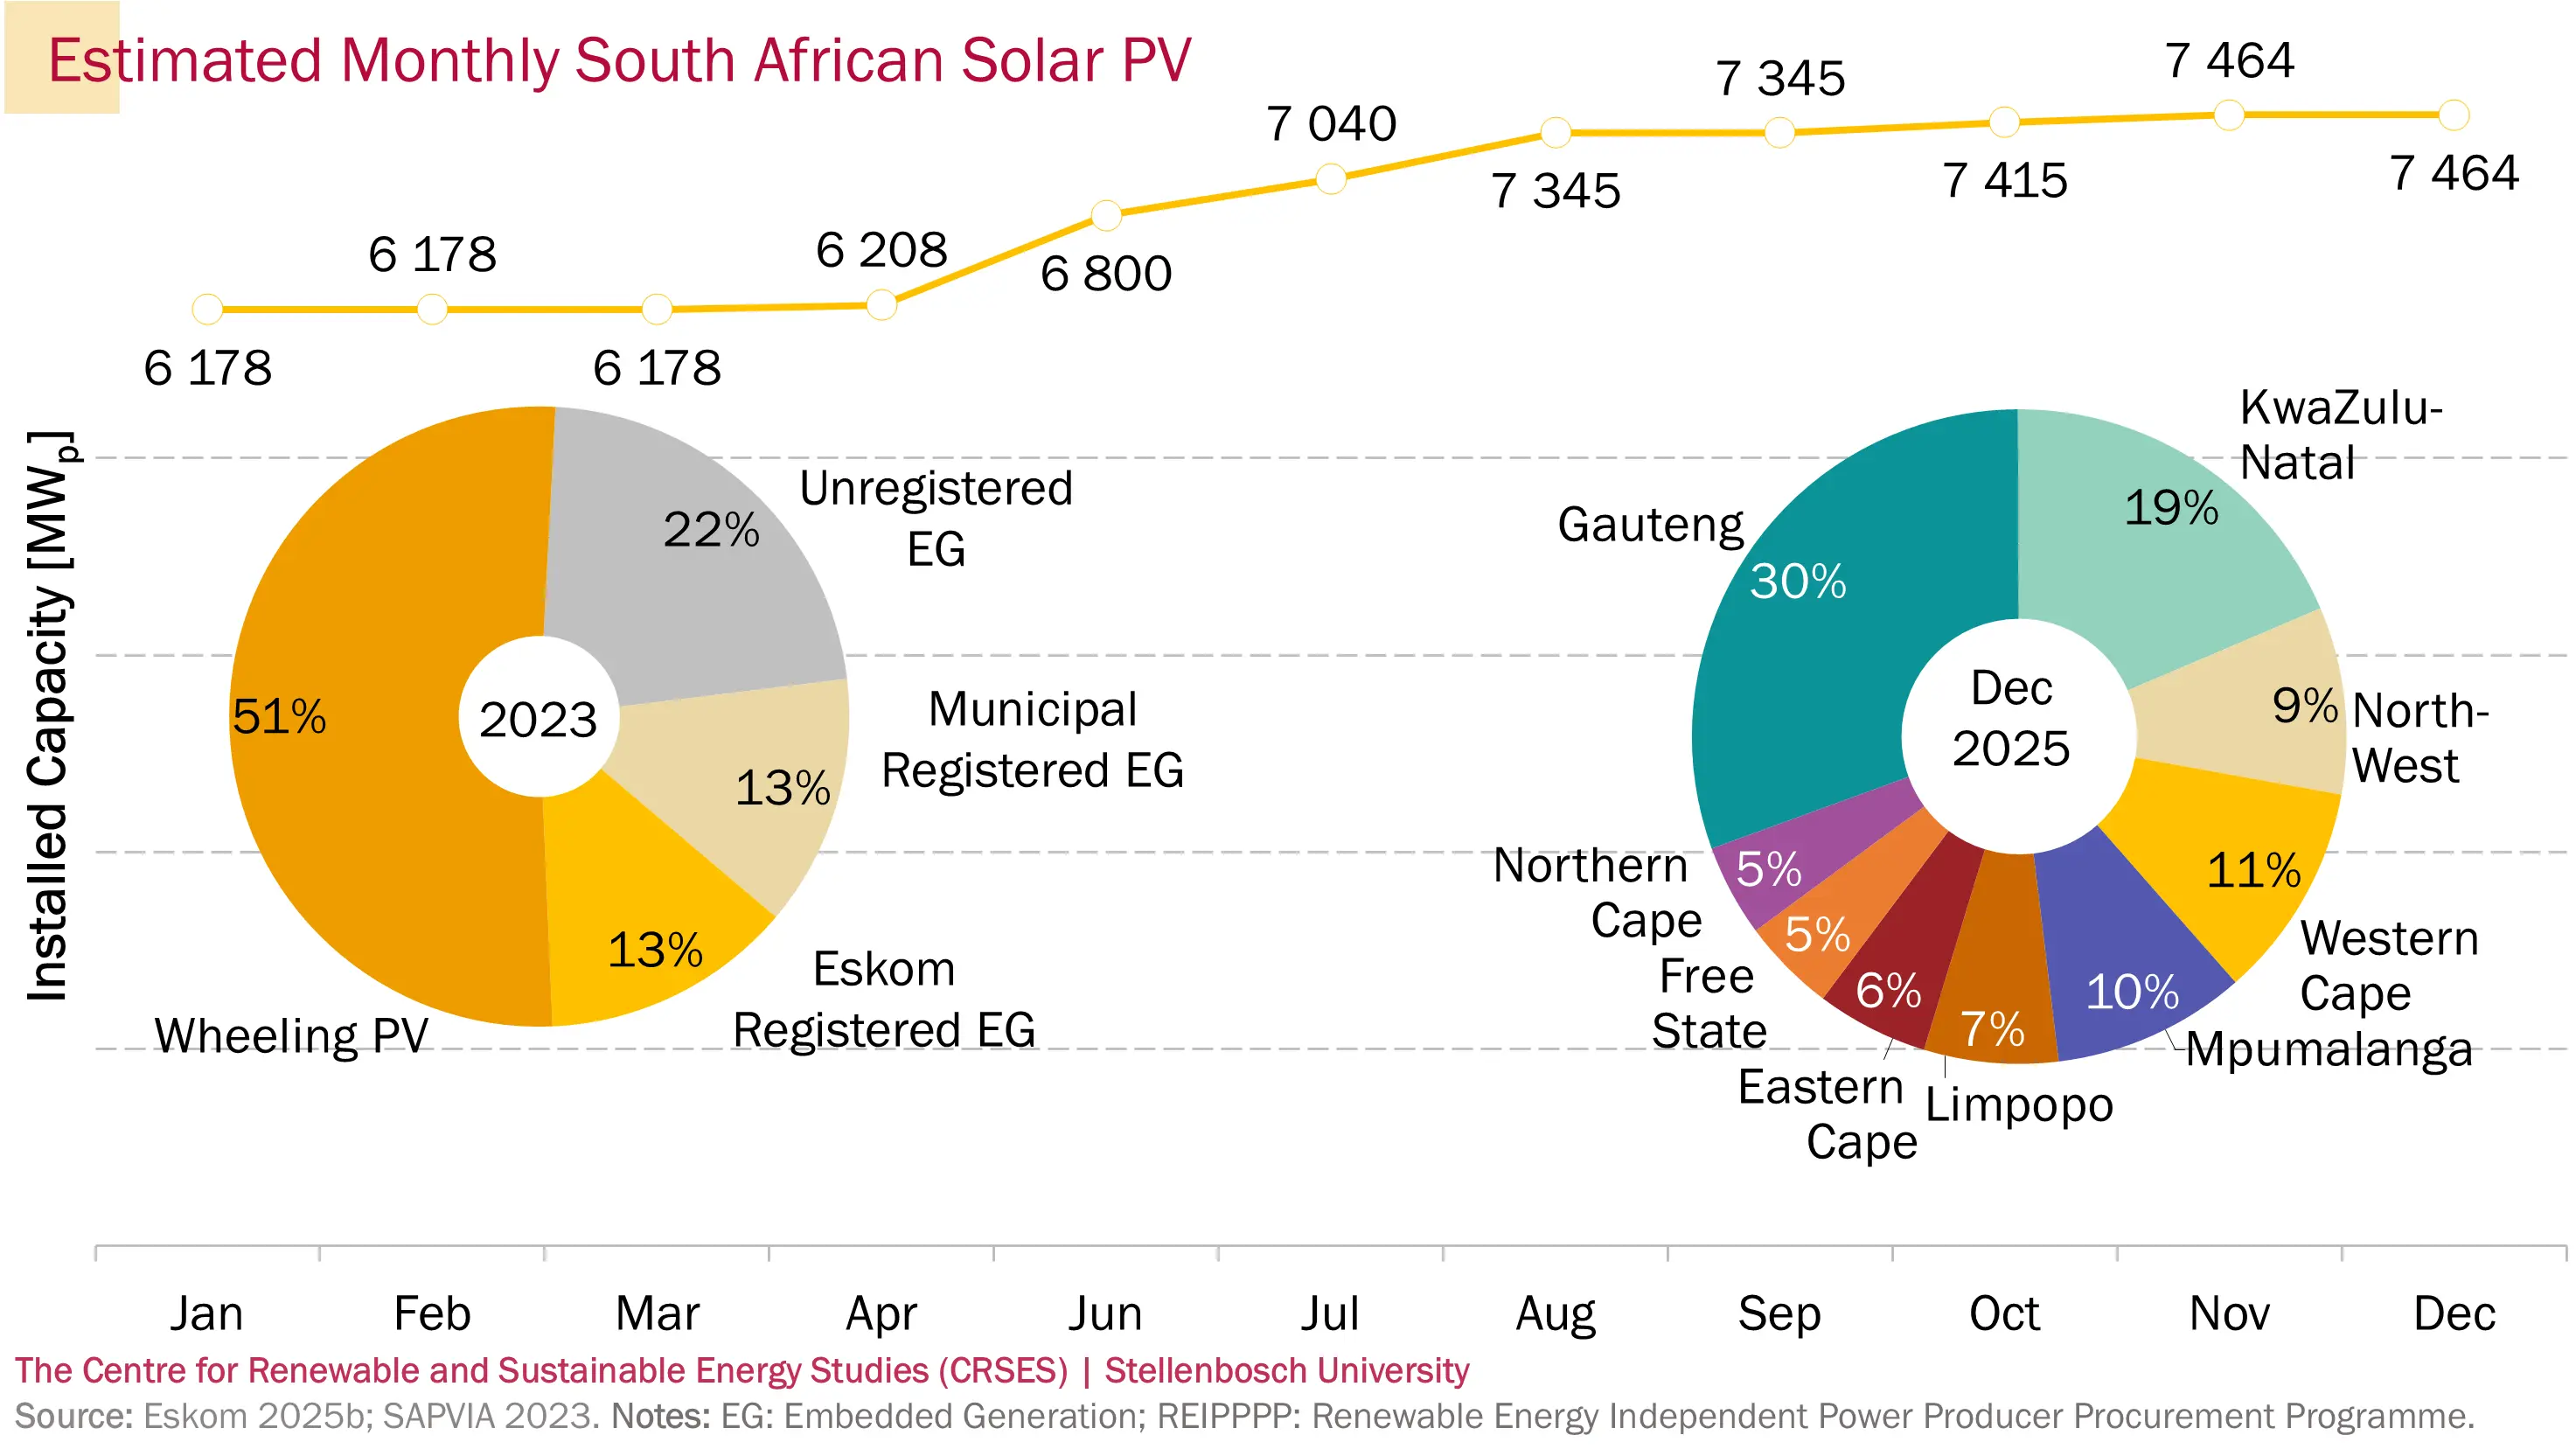
Embedded Generation (EG) refers to electricity that is generated within the distribution network and consumed locally, without the need for transmission via the national grid.
Wheeling is an arrangement with Eskom and/or a municipality that allows privately generated electricity to be transmitted across the distribution and/or transmission network to a specific customer, typically through a formalized agreement.
Utility Scale refers to electricity generation installations with a capacity typically larger than 50 MWₚ, intended primarily for supplying power to the national grid rather than for localized or private use.
Behind the Meter (BTM) refers to any energy generation, storage, or usage infrastructure located on the customer's side of an electricity meter, which typically represents the boundary between the public grid and private electrical infrastructure. Distribution utilities (e.g., municipalities) own infrastructure up to this point.
Customer PV Resource refers to photovoltaic (PV) electricity generated for the use of specific customers, encompassing all PV installations except those within the Renewable Independent Power Producer Procurement Programme (REIPPPP).
The installation of privately owned solar PV, also known as embedded generation or customer PV resource, has increased dramatically in recent years, driven by increasing electricity prices, decreasing solar PV technology costs and increased load shedding.
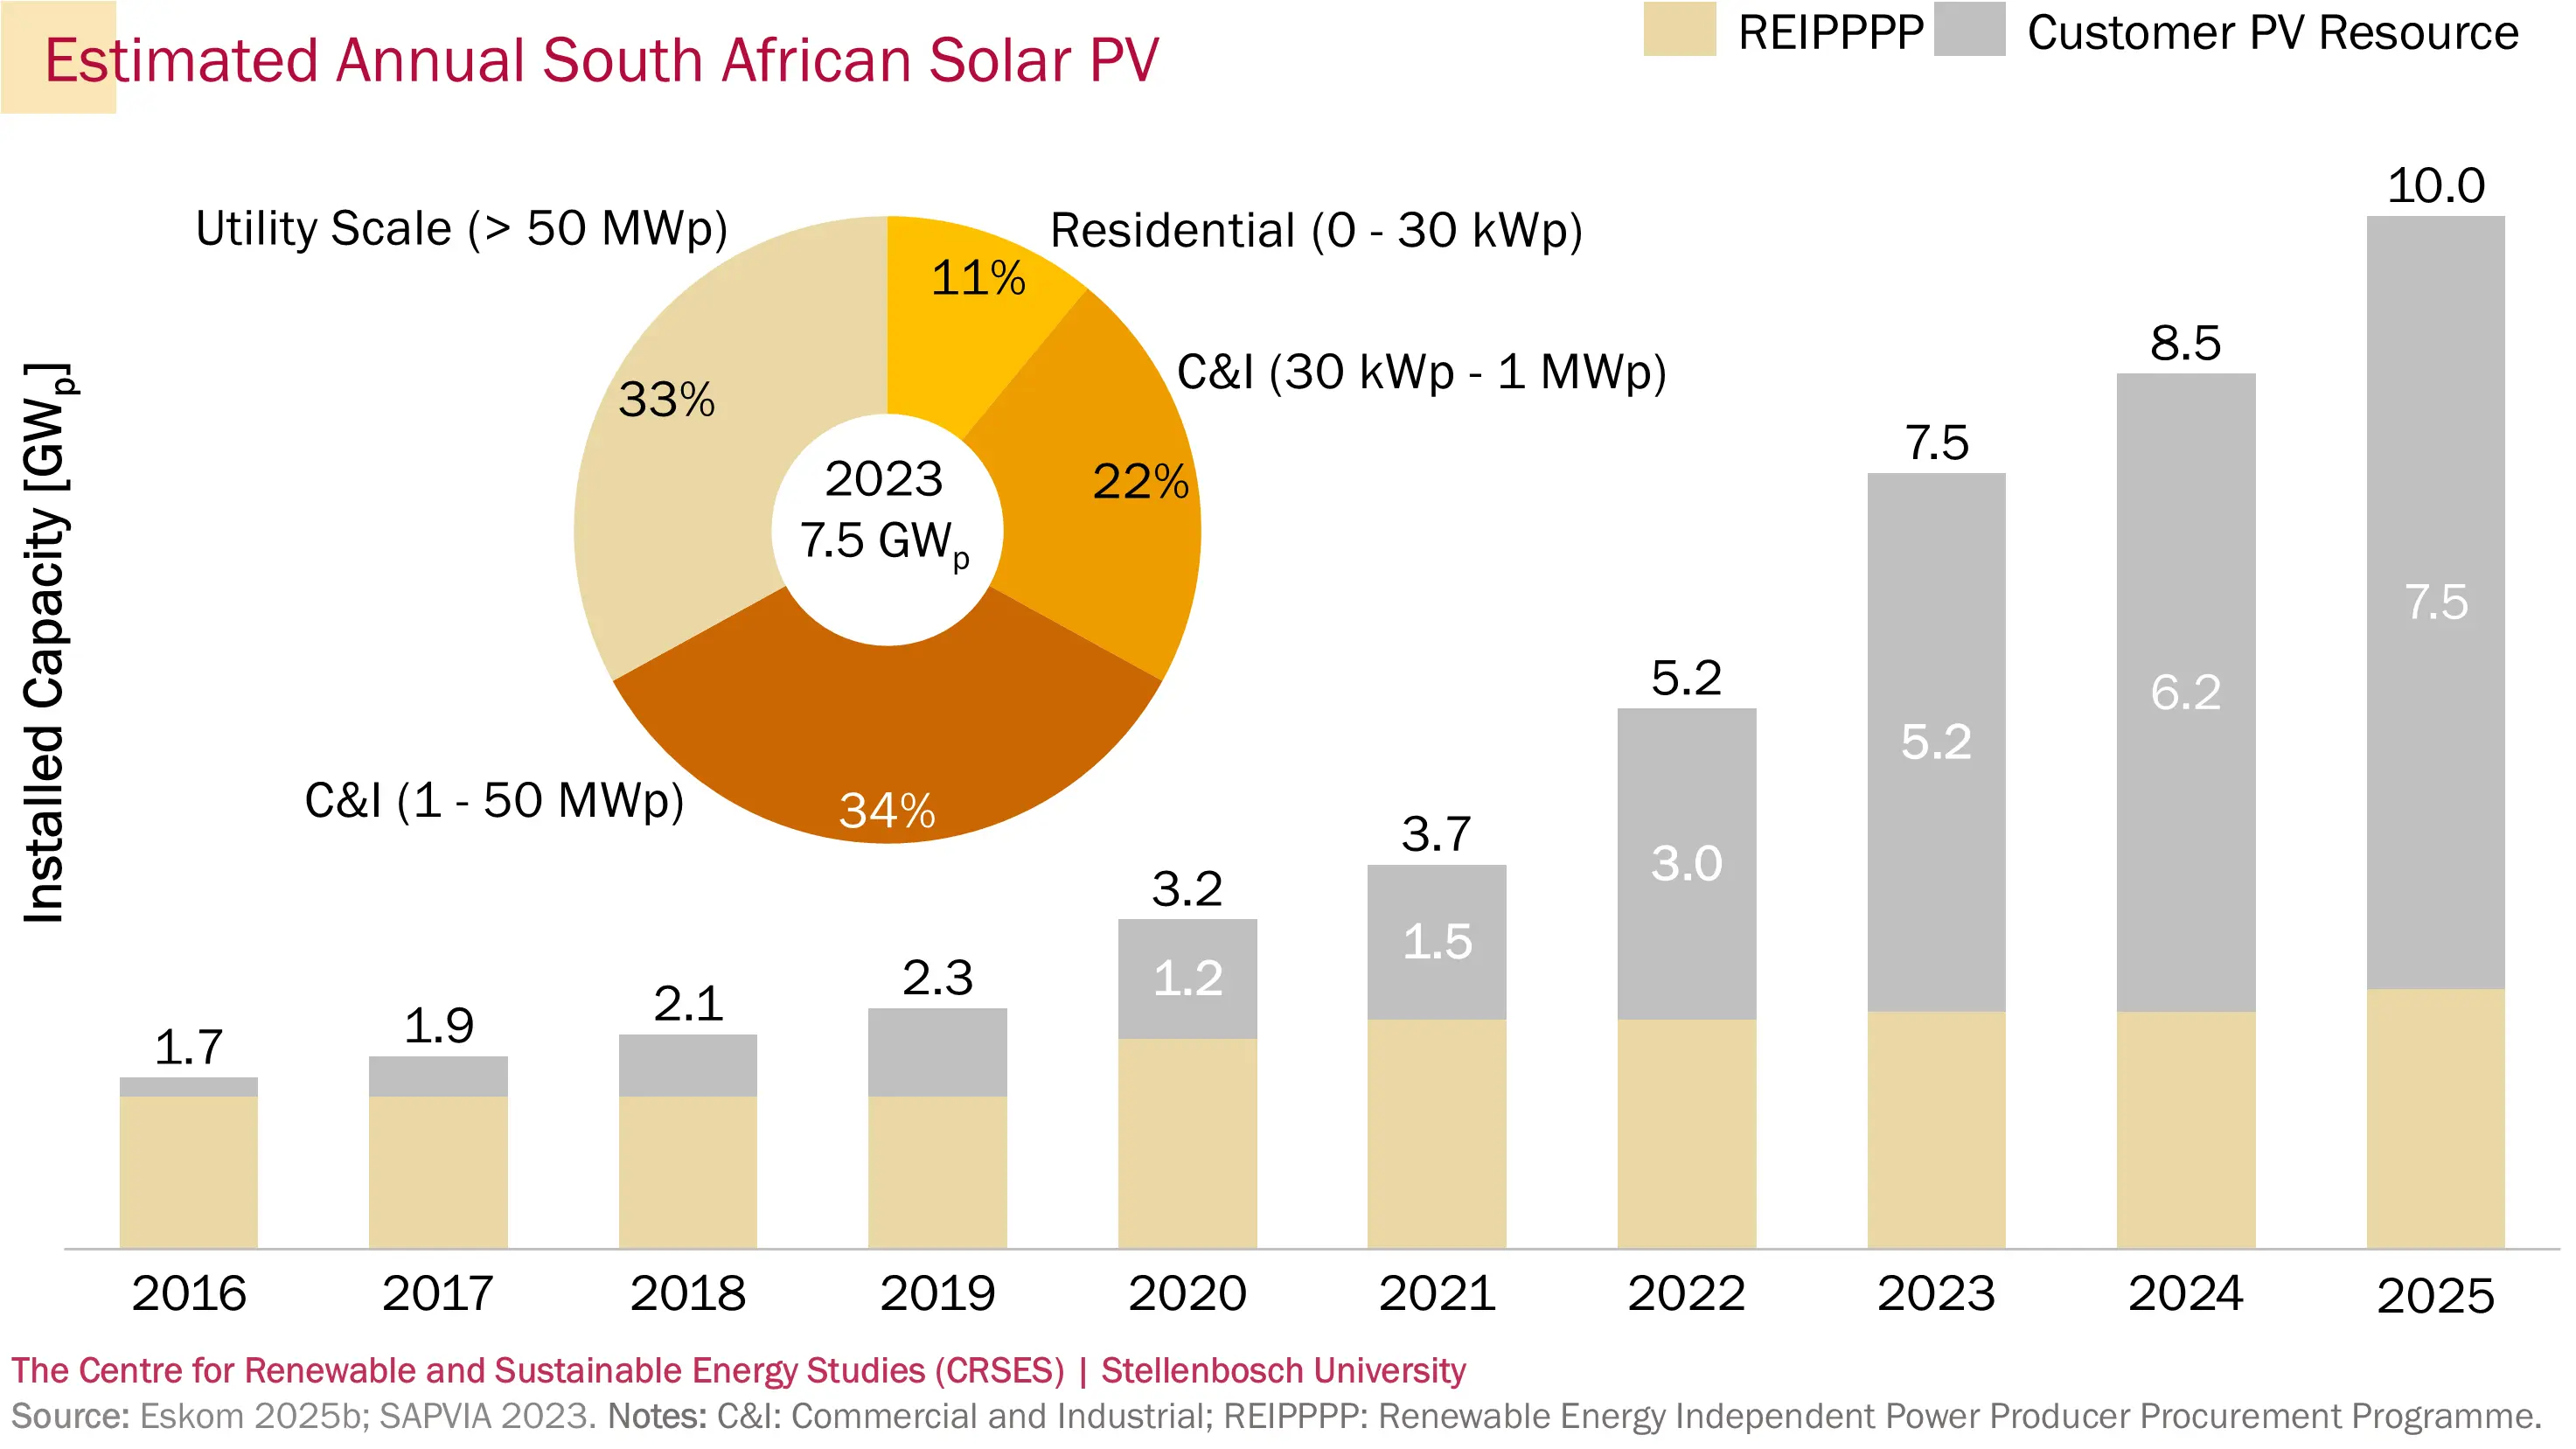
By May 2024, the capacity of embedded PV was almost double that of utility-scale PV. This contributes to South Africa's generation capacity, assisting with the mitigation of generation adequacy problems resulting in load shedding.
4. The Complexity of Integrating Variable Renewable Energy into the South African Power System
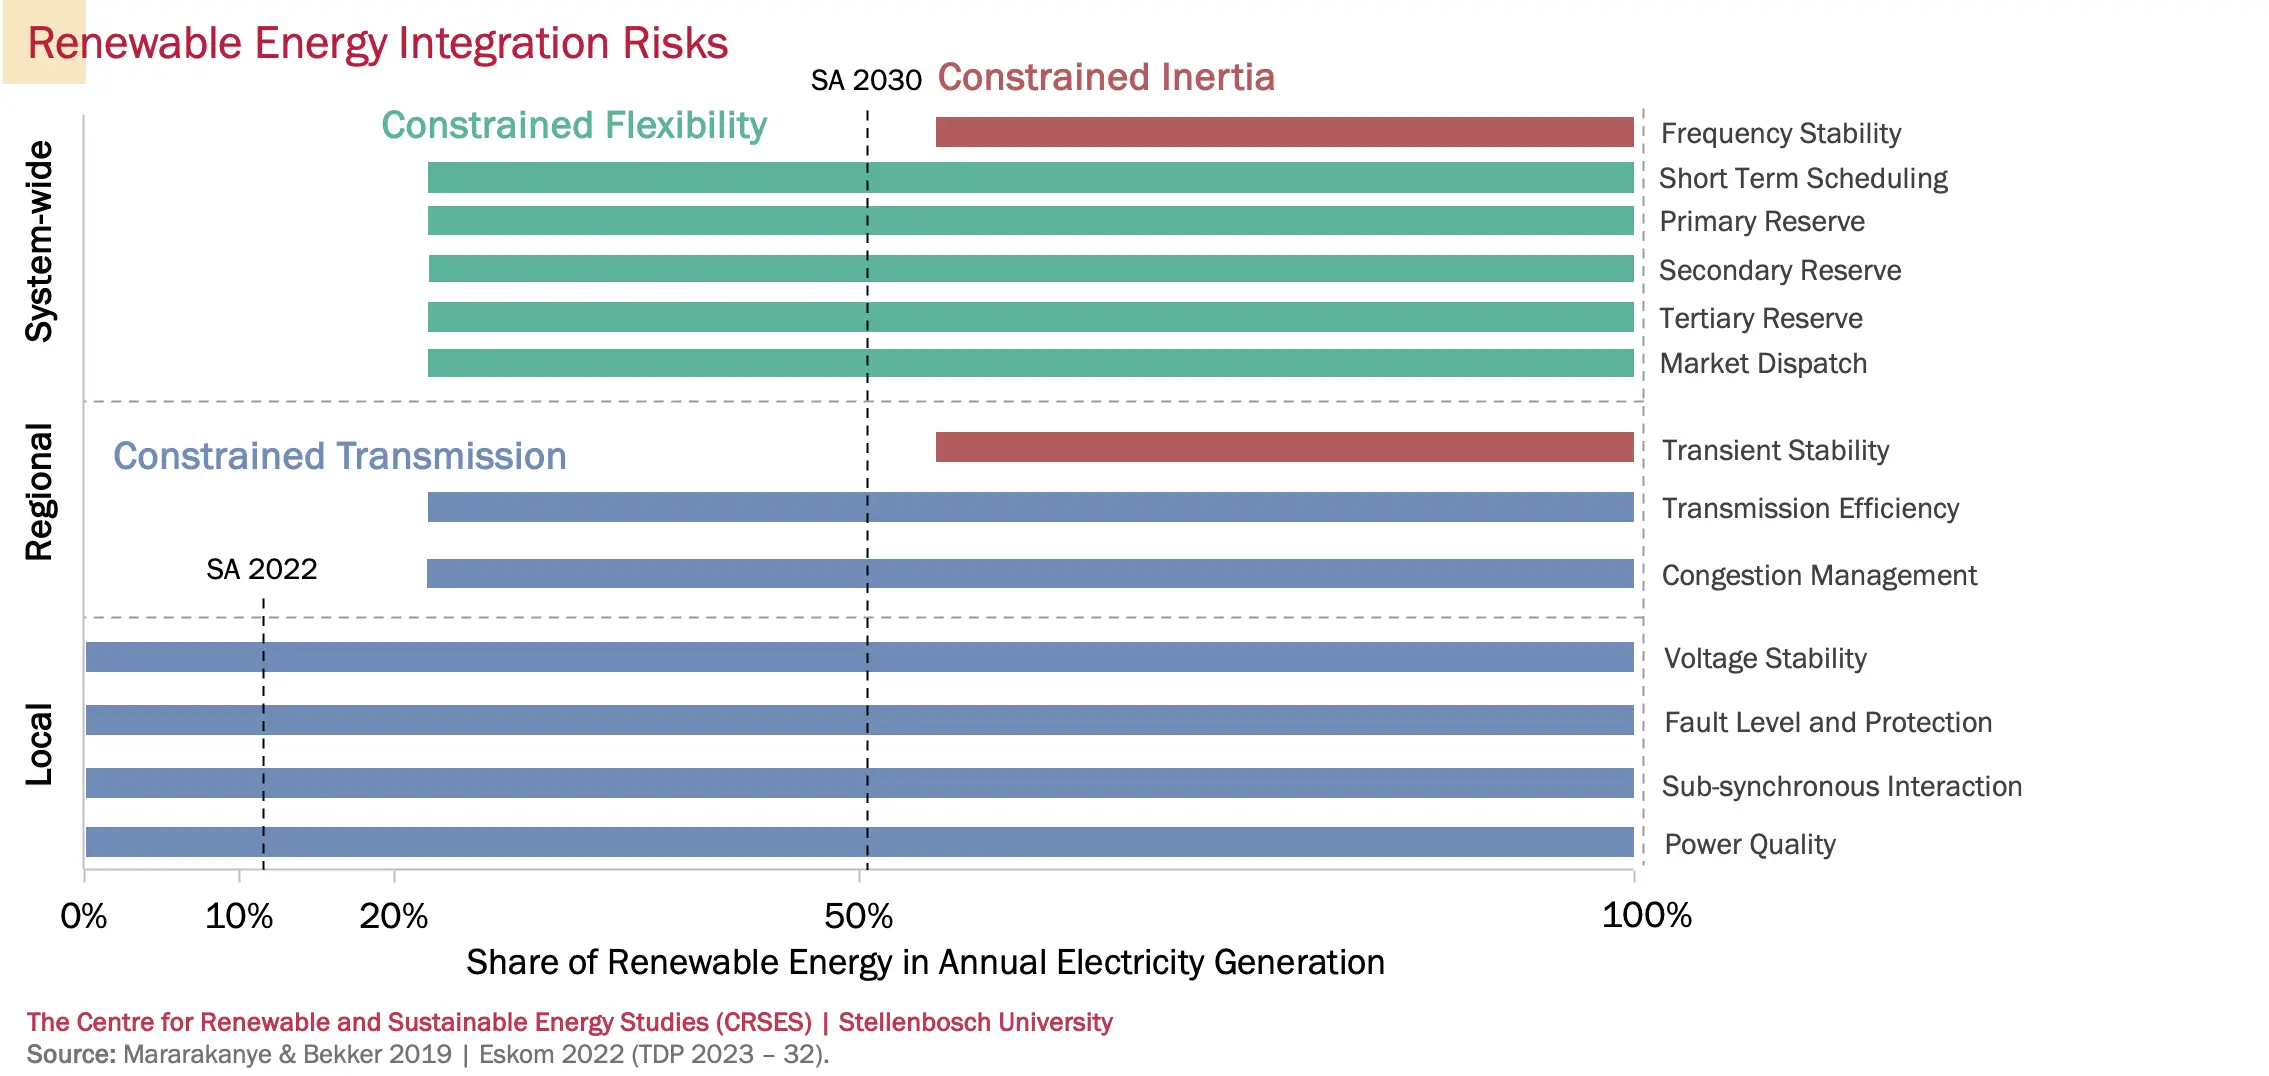
The integration of wind and solar PV into existing power systems impacts various technical aspects on a local, regional, and system-wide (national) level. With the continued increase in renewable energy generation capacity in SA's power system, it would be wise to learn from international experiences. This experience highlights that some of the first challenges that a power system experience as the level of renewable energy increases, is constrained transmission. SA is already experiencing this, as highlighted by Eskom's GCCA 2025 report (link). The next challenge that is typically experienced in power systems transitioning to significantly increased amount of renewable energy generation, is flexibility: a measure of how quickly the generation and load on a power system can respond to changing conditions. SA's current power system, dominated by coal, has very low flexibility which needs to be addressed as a matter of urgency as the share of renewables continue to rise.
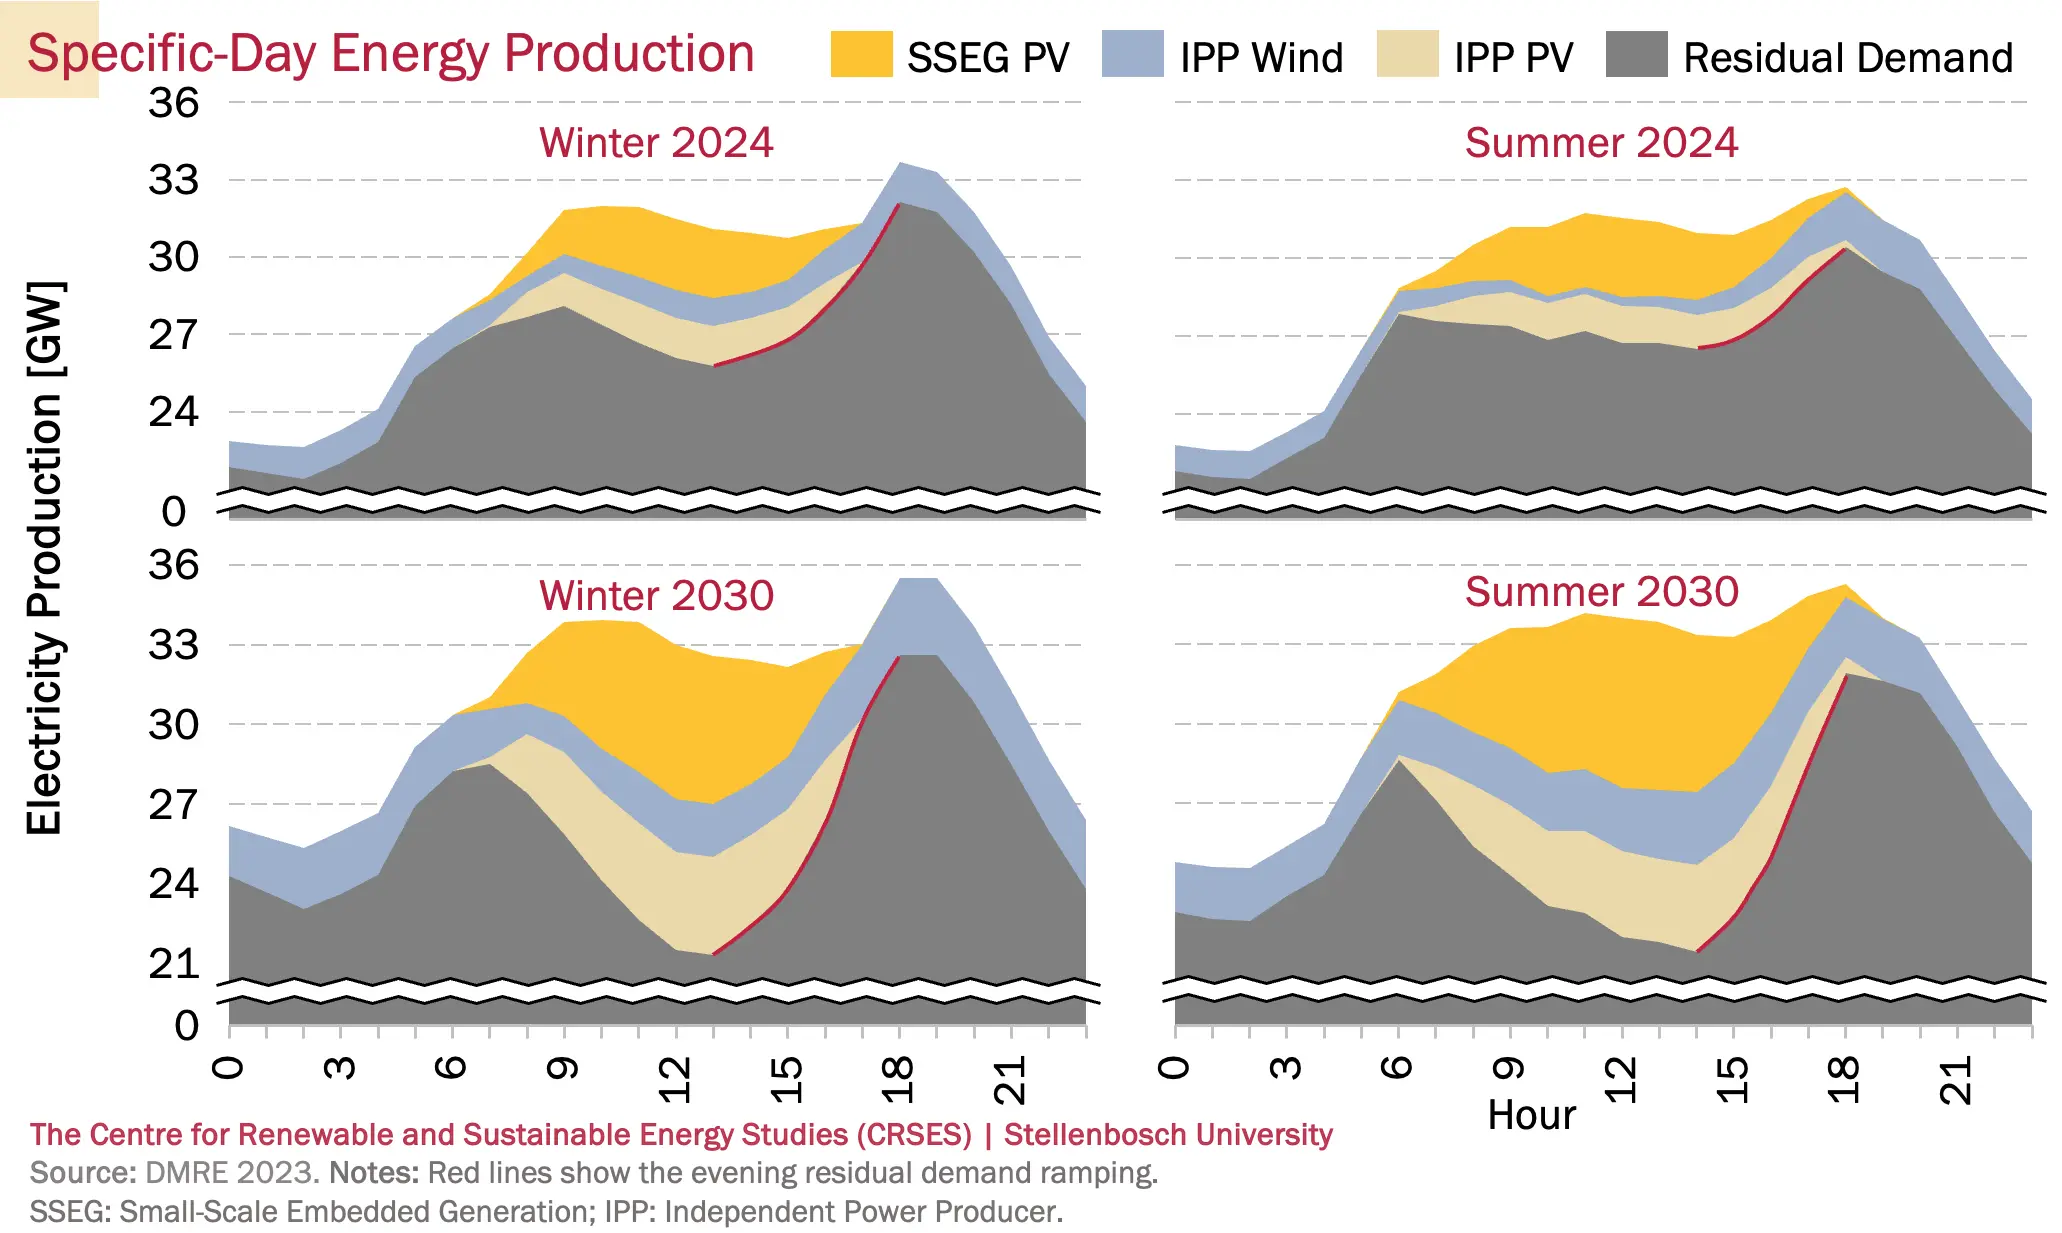
The contribution of renewable energy varies both daily and seasonally. Solar PV is not well aligned to the typical system electricity demand, as seen in the figures below.
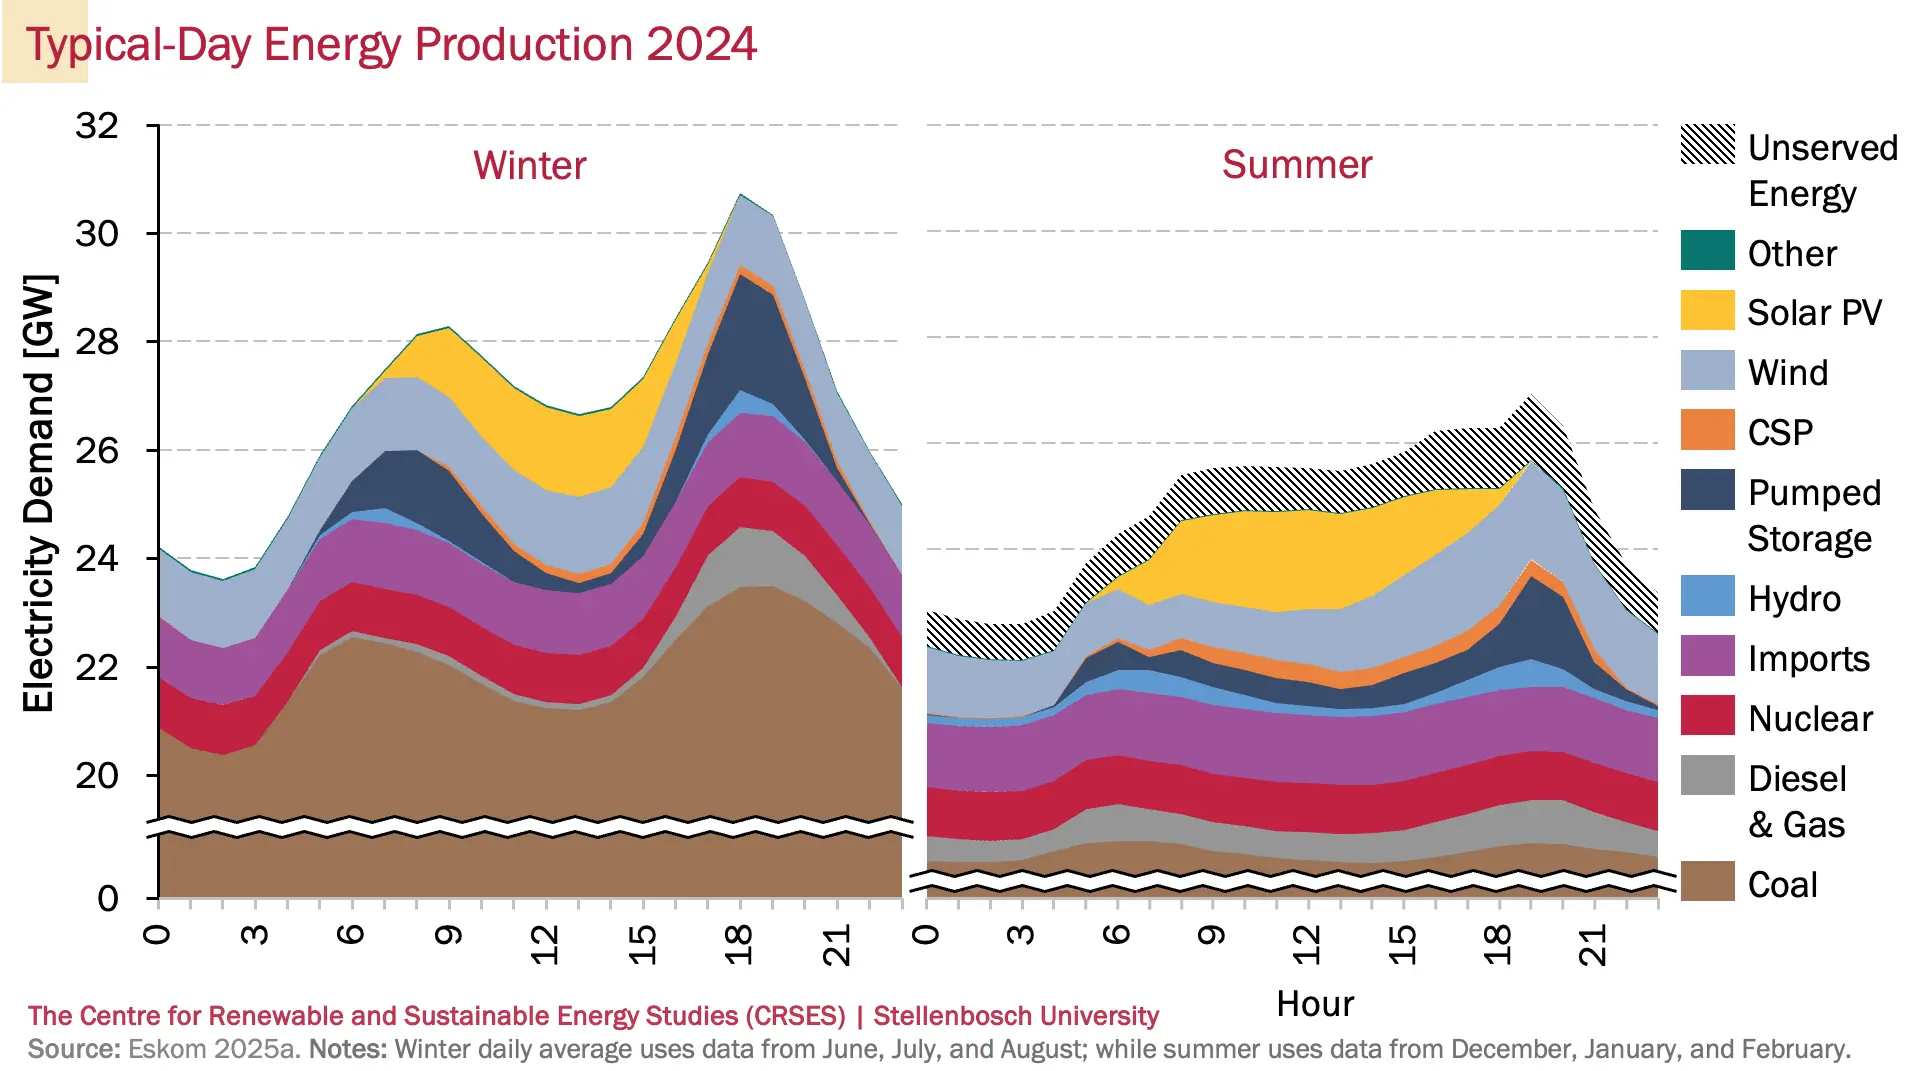
The introduction of PV into the electricity system (both on a utility scale and as embedded generation) will result in increased ramping being required from the rest of the system in the morning and evening. This phenomenon is commonly referred to as the duck curve. This can become a problem when the size of the required ramp starts to strain the ramping capabilities of the system. The drastic difference between 2024 and 2030 evening residual demand ramping is shown by the red lines in the following figure.
References
Chris Yelland 2023: Public post on X. https://x.com/chrisyelland/status/1715321394332930142
CSIR 2023: CSIR (2023). Statistics of utility-scale power generation in South Africa 2022, CSIR Energy Centre. https://www.csir.co.za/sites/default/files/Documents/Statistics%20of%20power%20in%20SA%202022-CSIR-%5BFINAL%5D.pdf
Data Commons 2025: Google (2023). South Africa GDP. https://datacommons.org/explore#q=South%20Africa%20GDP
DMRE 2023: Department of Mineral Resources and Energy (DMRE) South Africa (2023). Integrated Resource Plan (IRP) 2023.
Eskom 2022 (TDP 2023 – 32): Eskom Holdings SOC Ltd. (2022). The Eskom Transmission Development Plan (TDP) 2023 – 2032.
Eskom 2025: Eskom Holdings SOC Ltd. (2025). https://www.eskom.co.za/
2025a: Eskom Data Portal. https://www.eskom.co.za/dataportal/
2025b: Eskom System Status Reports. https://www.ntcsa.co.za/system-status-reports/
2025c: Eskom Annual Reports. https://www.eskom.co.za/heritage/annual-and-statistical-reports/
EskomSePush 2024: wellwellwell (Pty) Ltd. (2024). ESP – The Best Loadshedding app. https://esp.info/
Fraunhofer ISE 2021: Fraunhofer ISE (2021). Net Public Electricity Generation in Germany in 2020. Fraunhofer-Institute for Solar Energy Systems ISE, Freiburg. https://www.energy-charts.info/downloads/electricity_production_germany_2020_1.pdf
Hawkins 2018: Hawkins, E. (2018). 2018 visualisation update/ Warming Stripes for 1850–2018 using the WMO annual global temperature dataset. Climate Lab Book. https://www.climate-lab-book.ac.uk/2018/2018-visualisation-update/
IRENA 2023: International Renewable Energy Agency (IRENA) (2023). Renewable energy statistics 2023. www.irena.org
Mararakanye & Bekker 2019: Mararakanye, N., & Bekker, B. (2019). Renewable energy integration impacts within the context of generator type, penetration level and grid characteristics. Renewable and Sustainable Energy Reviews, 108, 441–451. https://doi.org/10.1016/J.RSER.2019.03.045
Merrill & Tewalt 2008: Merrill, M.D., and Tewalt, S.J. (2008). GIS representation of coal-bearing areas in Africa: U.S. Geological Survey Open-File Report 2008-1258. https://pubs.usgs.gov/of/2008/1258/
Our World in Data 2024: Annual CO2 emissions (2024). Our World in Data.
https://ourworldindata.org/grapher/annual-co2-emissions-per-country
SAPVIA 2023: SAPVIA (2023). SAPVIA Solar PV Installed Capacity Data Dashboard. https://sapvia.co.za/dataportal/dataportal-public
Statistics South Africa 2025: Department of Statistics South Africa. https://www.statssa.gov.za/
Sustainable Energy Africa 2020: George, X. (2020). State of Energy in South African Cities 2020. Sustainable Energy Africa.
https://www.cityenergy.org.za/state-of-energy-in-south-african-cities-2020/
World Bank Group 2023: World Bank Group (2023). Global Transmission Network.
https://energydata.info/dataset/global-transmission-network
Copyright: Visualisation of South African Energy Data © 2024 by The Centre for Renewable and Sustainable Energy Studies (Stellenbosch University) is licensed under CC BY-SA 4.0. Adapters must indicate any modifications made to the original work. Stellenbosch University is disclaimed as the copyright owner and bears no responsibility for the use of derivatives.
